Rainfall
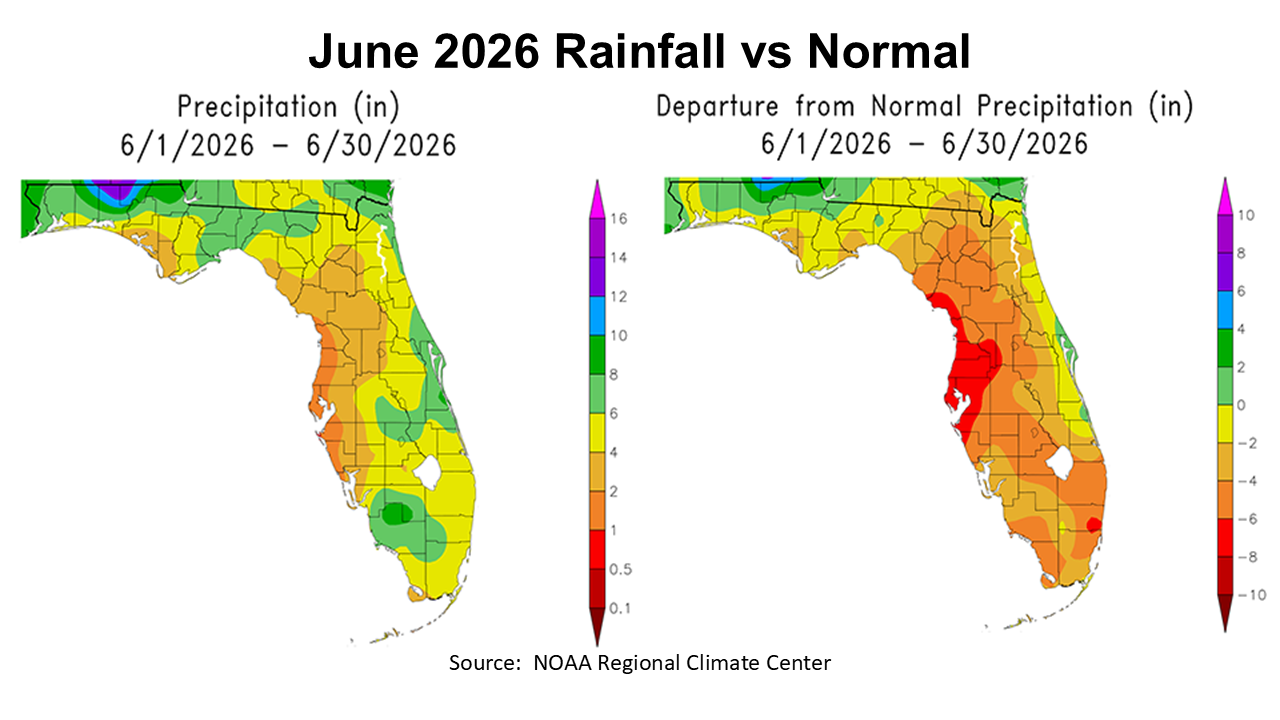
June 2026 brought significant rainfall to the Panhandle north of Interstate 10, but much of Florida remained drier than normal. The map above to the left shows the estimated rainfall totals for June 2026, ranging from 1-2″ in orange, 2-4″ in tan, 4-6″ in yellow, 6-8″ in light green, with a small area along the Alabama border in Walton and Holmes County receiving over 12″ in purple. The map to the right above shows how 2026 June rainfall compared with historic average. Only the portions of Florida in green or blue were near or above average.
–

The rainfall data from the eight Florida Automated Weather Network (FAWN) stations in the Panhandle provides a more precise total the region. The station near Jay had the highest total with 12.9″, which was 7.2″ above average. By contrast, the Carrabelle station along the Gulf Coast only received 2.7″ in June, which was -3″ below average. The average for all eight stations was 7.1″, which was 1.6″ above normal for the month.
Through the first half of the year, the DeFuniak station had over 40.3″, and was 11.4″ more than historic average. At Carrabelle, only 18.3″ was recorded, which was -7.1″ below average. The average for all eight stations was 27.7″, just 0.1″ above average.
–

The daily average -8″ soil moisture at the Marianna FAWN Station shows how the soil moisture rose and fell over the first half of 2026. While the highest level of 22.7% was recorded in June, there were also three days that the daily soil moisture was hovering around 8% the week before. This chart really shows that while the station at Marianna had 2.7″ more than historic average over the first six months, there were clearly some periods of short-term drought. It is not the total rainfall that fell, but when it fell that impacts crops and pastures. As you can clearly see, conditions have been much better the past two months.
–

The Florida Drought Monitor shows how much drought conditions improved from the end of April to the end of June. Looking at the June 30 Drought Monitor map, you can also see that the Panhandle improved significantly more than the rest of the state, especially north of I-10.
–
Temperatures
 June was a hot month, but the 10 days with rainfall helped keep the temperatures from reaching extremes most days. June was the first month to have high temperatures over 95°. The high 6′ air temperature for the month was 97° on June 30th. Contrast that with the low of 58° on June 4, the morning after a cold front passed through. It is not often that we have a single month with a 39° range. The average for June in Marianna was 80°.
The average soil temperature also rose significantly in June, with a high of 104° on June 12, 13, and 30. The average soil temperature was 85°.
–

The weather summary chart from the Marianna FAWN Station shows the monthly summaries through the first half of 2026. The average air temperature rose 6.3° from 73.5° in May to 79.8° in June. The average soil temperature increased 7° from 78° in May to 85° in June.
–
Climate Outlook
The Climate Prediction Center (CPC) provides one-month and three-month climate outlook maps showing the probability of how they expect temperatures and rainfall to compare with historic average.

The CPC’s outlook for August 2026 shows that there is a high probability (50-60% chance) that August will be hotter than normal all across Florida, with a low probability (33-40% chance) of below average rainfall in North Florida.
–

The CPC’s outlook for August through October once again shows a high probability (50-60% chance) that August will be hotter than normal all across Florida, but they make no prediction for rainfall over the three-month period. So, we can expect near normal rainfall through October.
–

The CPC also provides seasonal drought prediction maps. The August drought outlook has not been released yet. You can see in the maps above that much of the Panhandle is considered out of drought, and the rest of Florida is expected to see improvement in the coming months, with a few areas in olive green where they expect drought to end soon. Except for the areas shaded in brown, much of the U.S. is expected see improvement over the next three months.
–
El Niño Advisory
The CPC is even more convinced that a strong El Niño is coming. The chart below the text shows the high probability of a very strong ≥ 2° in October through January.
El Niño strengthened over the past month, with a large area of sea surface temperature anomalies in excess of +1.0°C across the central and eastern equatorial Pacific. The latest weekly Niño-3.4 index value was +1.2°C, with the westernmost (Niño-4) and easternmost (Niño-1+2) indices at +0.5°C and +2.7°C, respectively…Low-level westerly wind anomalies and upper-level easterly wind anomalies were observed over the western and central equatorial Pacific. Convection was enhanced over the central and east-central equatorial Pacific and was suppressed over Indonesia. The traditional and equatorial Southern Oscillation indices were significantly negative. Collectively, the coupled ocean-atmosphere system reflected a strengthening El Niño.
The North American Multi-Model Ensemble (NMME) average forecasts El Niño to intensify through 2026. Alongside model forecasts, a strong coupling of the atmospheric and oceanic circulation across the Pacific contributes to very high confidence that El Niño will continue through early 2027. There is an 81% chance of a very strong El Niño during October-December that would rank among the largest El Niño events in the historical record going back to 1950. Even the strongest El Niño events do not lead to the typical impact everywhere, but stronger events can more significantly tilt the odds in favor of expected outcomes. In summary, El Niño continues and will strengthen through the end of the year, with a 97% chance it will last through early spring 2027. Climate Prediction Center July 9, 2026

–
What this means for Panhandle farmers and ranchers?
It appears that the remainder of the growing season will remain near normal for rainfall across the Panhandle. The drought situation has gotten much better but remains an issue across much of Florida. It does appear short-term drought might affect the area in August, but the three-month forecast is positive. This fall and winter there is a good chance for above average rainfall from El Niño. This could offer some challenges at harvest time for peanuts, cotton, and hay. It does look like a good year for winter grazing and small grain crops though. It has been some time since we saw above average rainfall in the fall and winter. The current El Niño is gaining strength, which means the impacts are more certain. Instead of dodging Florida to the north, cold fronts should have greater impacts. Hurricane season is also impacted by the El Niño with reduced number of storms. After multiple years of below average rainfall influenced by La Niña, the winter of 2026-27 should be noticeably different as storms push more southward than the last few years. Too wet is not great either, but the current forecast makes me think that rain should be more consistent in the months ahead.

 0
0