In this blog…
Introduction
What’s lurking in Florida’s freshwater? Well, many things, to be quite frank. From fish to birds to the occasional river otter, people can expect to find several wonders in the freshwater ponds, lakes, streams, and rivers that Florida has to offer.
Now, a question for you…what do all of these animals rely on? Food, of course! At the very bottom of the food pyramid, just above plants and algae, are our beloved macroinvertebrates, an important food source for many of these animals. You may not have heard of the term, but you are more than likely familiar with snails, insects, spiders, shrimp, and worms. These are all considered macroinvertebrates.
…But what makes a macroinvertebrate?
Let’s break it down! Most of us are familiar with the term “micro,” as in microscope. We need a microscope to see very small creatures, like bacteria or nematodes. “Macro” encompasses anything that we can see with our eyes – without the need for a microscope. The next part of the equation is “invertebrate,” meaning without a backbone. There are many organisms that fit under that category.
See below for a quick guide to commonly encountered macroinvertebrates found here in Sarasota County.
Field guide to Sarasota’s macroinvertebrates
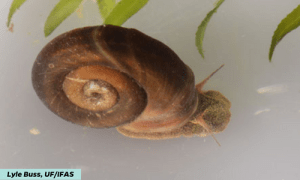
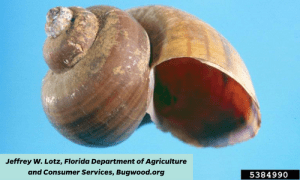
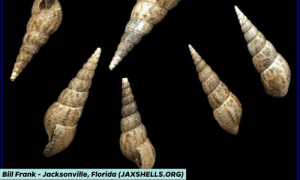
Snails
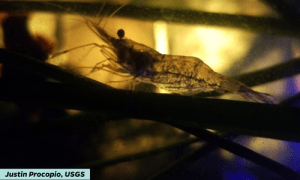
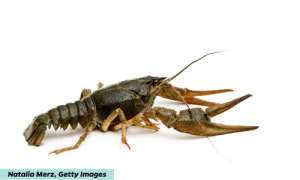
Crustaceans
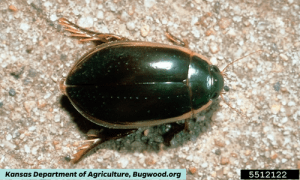
Beetles

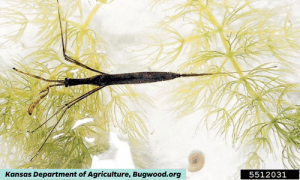
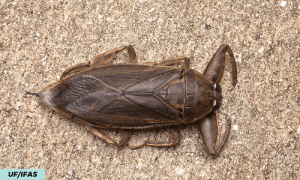
Bugs
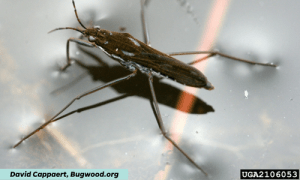
Mosquitos
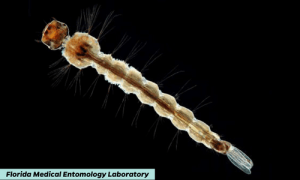
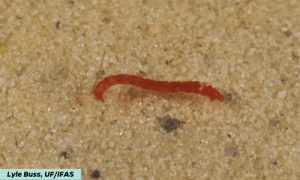
Midges
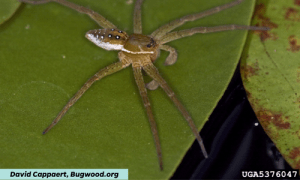
Spiders

Bioindicators
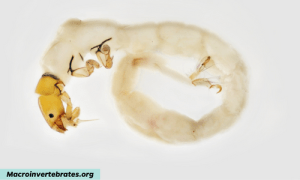
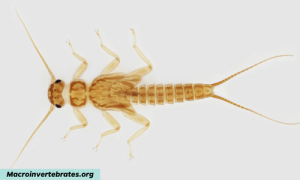
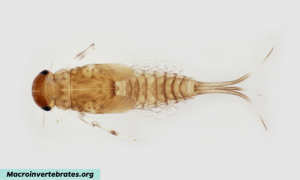
Macroinvertebrates and water quality
Several of these macroinvertebrates are sensitive to pollution and do not fare well in poor water quality. Those that are the most sensitive to changes in water quality are considered “bioindicators” by limnologists and other scientists who study these freshwater systems. They only respond well to certain living conditions, and their presence in a waterbody typically means that the water quality is good. Some of those conditions can easily be measured, such as the pH of the waterbody, its temperature, and how much dissolved oxygen it has. You can reference the charts below to get an idea of what conditions may be more favorable for aquatic life.
pH:
| pH RANGES | |
| 0.0 – 6.4 | Low/Acidic: Stressful or deadly to many aquatic organisms |
| 6.5 – 9.0 | Recommended (7 is Neutral): Optimal for most common aquatic organisms |
| 9.1 – 14.0 | High/Basic: Stressful or deadly to many aquatic organisms |
Source: EPA
Temperature:
| TEMPERATURE | |
| <15 °C | Low/Cold: May slow metabolism or affect reproduction |
| 15 – 35 °C | Recommended: Optimal for most common aquatic organisms |
| >35 °C | High/Hot: Decreases dissolved oxygen in the water and increases mortality |
Source: UF/IFAS Extension
Dissolved Oxygen (DO):
| DISSOLVED OXYGEN LEVELS | |
| 0 – 3 ppm or mg/L | Poor: Prolonged exposure is deadly to most organisms |
| 4 – 6 ppm or mg/L | Stressful: Stressful to most aquatic organisms |
| 7 – 10 ppm or mg/L | Excellent: Usually needed for growth and activity |
Source: EPA
Experiment: Calculate Your Pond’s Biodiversity!
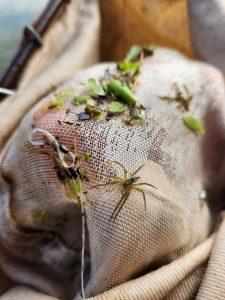 Do you have access to a pond or lake in your neighborhood? Oftentimes, regardless of which species you encounter in your pond or other waterbody, the variety and number of species you find, otherwise known as the “biodiversity,” can be a measure of a healthy, functional ecosystem.
Want to try it out? You’ll need a dip net (with a “D” shaped frame) and collection bin first, which can both be purchased online or at your local hobby store. Once you have your equipment, follow the steps below. Make sure to check for alligators before you take any samples! Do not sample in any areas where there are active alligators nearby.
- Fill the bin about halfway with water from the pond.
- Face the flat side of the frame at the bottom of the sediment and gently shuffle it around.
- Turn the net around and do the same in the other direction. Repeat about 5 times.
- Take your dipnet out of the water.
- Invert the net into your collection bin, and swish it around to make sure all your captured organisms are in the water.
- Count what you found!
- Remember to be respectful of the living creatures you collected. Place them back where you caught them after you finish counting.
Use the table below or print out a copy here to calculate your neighborhood pond’s biodiversity. Comment your biodiversity index below!
Data table
| Species | # of each |
| Total: | Total: |
Biodiversity Index: Total #Species (Richness)/Total #Each (Evenness) = ?
Resources
- Indicators: Benthic Macroinvertebrates: https://www.epa.gov/national-aquatic-resource-surveys/indicators-benthic-macroinvertebrates
- Macroinvertebrate ID Guide: https://www.macroinvertebrates.org/
- More on macros from the Shroud Water Research Center: https://stroudcenter.org/macros/
 5
5
