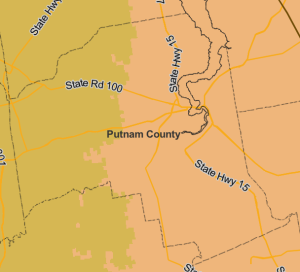
November brought several changes. We experienced cooler weather, adjusted our clocks, and entered the holiday season. Another notable change could impact our gardening choices. The USDA recently updated the Plant Hardiness Zone Map, revealing a shift for parts of Putnam County.
What is the Plant Hardiness Zone Map?
The Plant Hardiness Zone Map uses data on average extreme minimum winter temperatures, shown as 5-degree Fahrenheit zones. In the new map, the USDA used a 30-year average (1991-2020) to identify any changes in the zones. The zones are numbered from 1 to 13, with 1 as the coldest and 13 as the warmest. Shifts happen when minimum temperatures increase. This information is then used to determine if an area is too hot or too cold for different plants to survive. Plant trials are used to identify the zones that they are best grown in.
What does this change mean?
Changes to the Plant Hardiness Zones impact the types of perennial plants suitable for our area, mainly due to rising temperatures. The shift from Zone 9a to 9b, while subtle with a mere 5-degree minimum temperature adjustment, excludes some recommended temperate plants for our region. Unfortunately, despite the change, freezing temperatures persist, limiting our ability to cultivate tropical plants.
Plant Hardiness Zones vs Chill Hours
It’s crucial to note that these maps don’t reflect changes in chill hour accumulation. As mentioned earlier, Plant Hardiness Zones rely on average temperature extremes over a historical period of time. Chill hours, on the other hand, represent the seasonal accumulation of temperatures below 45 degrees F, crucial for certain trees and shrubs—especially fruit-bearing ones—to break dormancy and flower. When selecting fruit tree varieties, it’s essential to consider information from both factors to ensure they survive and produce fruit. You can find a link below to a website that uses national weather data to provide current accumulated chill hour information.
The transition in these maps shouldn’t be surprising, given the observable trend of our days becoming warmer and experiencing fewer instances of extremely low temperatures. Recognizing these shifts is instrumental in planning and choosing plants that can thrive in the evolving climate. Always keep in mind the principle of “Right plant, Right Place” and consult the recommended plant hardiness zone before acquiring any tree, shrub, or perennial plant. This adherence serves as the cornerstone for cultivating a Florida-Friendly Landscape™, ensuring a successful and stress-free outdoor environment.
Helpful Resources:
2023 USDA Plant Hardiness Zone Map
AgroClimate Chill Hours Calculator
 4
4
