Cities around the world are recognizing that urban tree canopy contributes to more comfortable living conditions. Tree canopy lowers urban temperatures, increases water evaporation and removes air pollutants caused by everyday urban activities. Often overlooked are the value of tree lined streets. Today they are providing soothing and shaded outdoor space for walking, biking or just taking a break from the self-isolation imposed by the COVID-19 pandemic.
Limited availability of outdoor space combined with strained environmental conditions and reduced physical activity lead to chronic stress. Stress weakens our immune systems. Stress makes us more susceptible to infection. Access to green outdoor space has been severely limited by the closing of parks and recreation centers during COVID-19. City streets are now the only public space for relief from self-isolation.
This dilemma has made it very clear that in our rapidly urbanizing world there is a critical need for urban planners, public health workers and conservationists to collaborate in creating healthy city environments. The first step would be to assess the physical and visual accessibility of treed open space to city residents. This includes the entire street system.
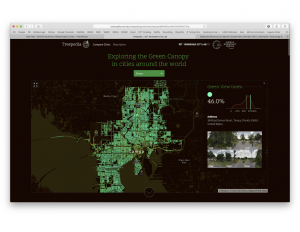
Analysis of urban tree canopy uses aerial photos and satellite imagery. This gives us an excellent measure of total tree canopy cover. It does not tell us what is seen or experienced by the people on the ground. Recently the Massachusetts Institute of Technology (MIT) developed a tool to calculate the visual green percentage of the city from the street level. We now have the ability to assess physical and visual accessibility to green space from the human perspective.
Investigators at MIT developed the Green View Index (GVI). It uses Google Street View images and focuses entirely on street trees. GVI maps the amount of vegetation cover along a city’s streets by calculating the percent view obstruction by tree canopies.
MIT has released the entire their library of GIS modules and user guides online. The library and user guide are free. This Python library includes all the python modules to let anyone compute the GVI for their own city or region. All you will need is the street network for your city in the form of a GIS file and a Google StreetView API key(s).
Give it a try and compute the tree cover for your city! (https://github.com/mittrees/Treepedia_Public)
Visit MIT’s Sensible City Lab to explore the development and use of this tool, and to review some of the world’s cities that have already investigated. MIT Senseable City Lab
 1
1
