The UF IFAS Lakewatch Program trains local volunteers on how to sample for water quality analysis. Lakewatch monitors nutrients in the water that could trigger algal blooms, low dissolved oxygen, and possible fish kills. Our bay system, particularly the bayous, experienced large fish kills in the 1960s and 1970s due to excessive nutrients in the waters.
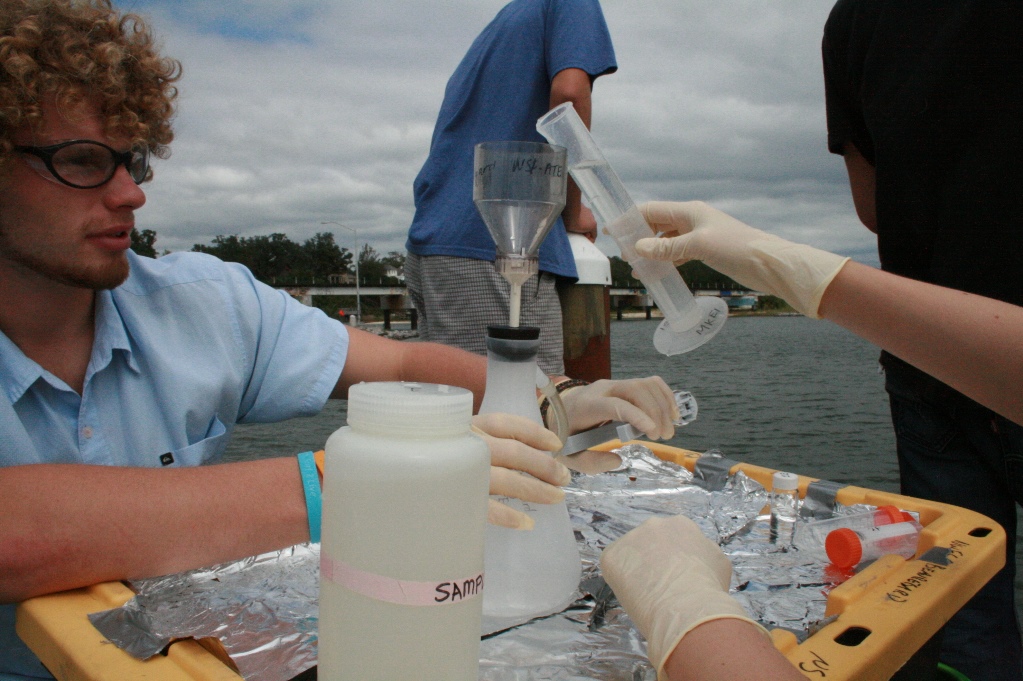
Photo: Marine Science Academy Washington High School
Volunteers use their own boats to collect samples from three sites in their assigned body of water. The samples are frozen until we can get them to the Lakewatch lab at the University of Florida in Gainesville. The samples are analyzed for total phosphorus and total nitrogen – nutrients known to trigger algal blooms, low dissolved oxygen, and fish kills. Total chlorophyll is analyzed as a proxy to the concentration of algae in the water. Water clarity is measured using a Secchi disk from the boat. Eutrophic water systems will have lower water clarity.
Below are the current data from this program.
BAYOU CHICO (2014-2024)
Site 1 – 30.403; -87.2638
| Parameter | No. of samples | Minimal Geometric Mean | Maximum Geometric Mean | Grand Geometric Mean |
| Total Phosphorus
(µg/L) |
10 | 12 | 75 | 26 |
| Total Nitrogen
(µg/L) |
10 | 272 | 851 | 506 |
| Total Chlorophyll
(µg/L) |
10 | 6 | 89 | 13 |
| Water Clarity
(ft) |
9 | 3 | 4 | 3 |
Trend Over Time:
Total Phosphorus – decreasing
Total Nitrogen – no change
Total Chlorophyll – decreasing
Water Clarity – increasing
Site 2 – 30.405; -87.2594
| Parameter | No. of samples | Minimal Geometric Mean | Maximum Geometric Mean | Grand Geometric Mean |
| Total Phosphorus
(µg/L) |
10 | 15 | 93 | 25 |
| Total Nitrogen
(µg/L) |
10 | 344 | 990 | 537 |
| Total Chlorophyll
(µg/L) |
10 | 7 | 42 | 12 |
| Water Clarity
(ft) |
9 | 3 | 5 | 4 |
Trend Over Time:
Total Phosphorus – decreasing
Total Nitrogen – decreasing
Total Chlorophyll – decreasing
Water Clarity – increasing
Site 3 – 30.4004; -87.2443
| Parameter | No. of samples | Minimal Geometric Mean | Maximum Geometric Mean | Grand Geometric Mean |
| Total Phosphorus
(µg/L) |
10 | 15 | 36 | 21 |
| Total Nitrogen
(µg/L) |
10 | 298 | 438 | 358 |
| Total Chlorophyll
(µg/L) |
10 | 3 | 24 | 8 |
| Water Clarity
(ft) |
9 | 3 | 6 | 4 |
Trend Over Time:
Total Phosphorus – decreasing
Total Nitrogen – remains the same
Total Chlorophyll – decreasing
Water Clarity – decreasing
Summary for Bayou Chico
Total phosphorus is about the same across the bayou and has been decreasing over time.
Total nitrogen is higher in the upper and middle reaches of the bayou and remains unchanged over time.
Total chlorophyll is higher in the upper and middle reaches of the bayou and has decreased over time.
Water clarity is about 3-4 feet across the bayou and has been increasing over time at Sites 1 and 2, but has been decreasing at Site 3.
These data suggests that things have – overall – been improving in Bayou Chico since 2014.
BAYOU GRANDE (2012-2024)
Site 1 – 30.3718; -87.3109
| Parameter | No. of samples | Minimal Geometric Mean | Maximum Geometric Mean | Grand Geometric Mean |
| Total Phosphorus
(µg/L) |
11 | 11 | 26 | 14 |
| Total Nitrogen
(µg/L) |
11 | 172 | 475 | 296 |
| Total Chlorophyll
(µg/L) |
10 | 1 | 7 | 3 |
| Water Clarity
(ft) |
10 | 2 | 9 | 5 |
Trends Over Time:
Total Phosphorus – decreasing
Total Nitrogen – decreasing
Total Chlorophyll – decreasing
Water Clarity – increasing
Site 2 – 30.3721; -87.2947
| Parameter | No. of samples | Minimal Geometric Mean | Maximum Geometric Mean | Grand Geometric Mean |
| Total Phosphorus
(µg/L) |
11 | 11 | 22 | 14 |
| Total Nitrogen
(µg/L) |
11 | 192 | 405 | 276 |
| Total Chlorophyll
(µg/L) |
10 | 2 | 10 | 4 |
| Water Clarity
(ft) |
10 | 3 | 8 | 6 |
Trend Over Time:
Total Phosphorus – decreasing
Total Nitrogen – decreasing
Total Chlorophyll – slightly decreasing
Water Clarity – increasing
Site 3 – 30.3731; -87.2792
| Parameter | No. of samples | Minimal Geometric Mean | Maximum Geometric Mean | Grand Geometric Mean |
| Total Phosphorus
(µg/L) |
11 | 12 | 22 | 16 |
| Total Nitrogen
(µg/L) |
11 | 217 | 450 | 296 |
| Total Chlorophyll
(µg/L) |
10 | 2 | 13 | 4 |
| Water Clarity
(ft) |
10 | 4 | 8 | 6 |
Trend Over Time:
Total Phosphorus – decreasing
Total Nitrogen – decreasing
Total Chlorophyll – decreasing
Water Clarity – increasing
Summary for Bayou Grande
There has been improvement in all parameters over time.
Values are about the same across the bayou
Nutrients are much lower, and water clarity higher, in Bayou Grande than in Bayou Chico.
Water Clarity is 5-6 feet.
BAYOU TEXAR SOUTH (2000-2002)
Site 1 – 30.4277; -87.19
| Parameter | No. of samples | Minimal Geometric Mean | Maximum Geometric Mean | Grand Geometric Mean |
| Total Phosphorus
(µg/L) |
3 | 16 | 32 | 22 |
| Total Nitrogen
(µg/L) |
3 | 279 | 547 | 359 |
| Total Chlorophyll
(µg/L) |
3 | 3 | 12 | 6 |
| Water Clarity
(ft) |
3 | 2 | 4 | 3 |
Trend Over Time:
Only 3 samples were analyzed in the two-year period. No trends available.
Site 2 – 30.4244; -87.1885
| Parameter | No. of samples | Minimal Geometric Mean | Maximum Geometric Mean | Grand Geometric Mean |
| Total Phosphorus
(µg/L) |
3 | 21 | 34 | 25 |
| Total Nitrogen
(µg/L) |
3 | 369 | 483 | 406 |
| Total Chlorophyll
(µg/L) |
3 | 4 | 15 | 9 |
| Water Clarity
(ft) |
3 | 1 | 4 | 2 |
Trend Over Time:
Only 3 samples were analyzed in the two-year period. No trends available.
BAYOU TEXAR (2007-2024)
Site 1 – 30.452; -87.2003
| Parameter | No. of samples | Minimal Geometric Mean | Maximum Geometric Mean | Grand Geometric Mean |
| Total Phosphorus
(µg/L) |
18 | 13 | 23 | 17 |
| Total Nitrogen
(µg/L) |
18 | 587 | 1074 | 788 |
| Total Chlorophyll
(µg/L) |
18 | 2 | 11 | 6 |
| Water Clarity
(ft) |
18 | 3 | 5 | 4 |
Trend Over Time:
Total Phosphorus – slight decrease
Total Nitrogen – slight decrease
Total Chlorophyll – remains the same
Water Clarity – increasing
Site 2 – 30.4456; -87.1878
| Parameter | No. of samples | Minimal Geometric Mean | Maximum Geometric Mean | Grand Geometric Mean |
| Total Phosphorus
(µg/L) |
18 | 13 | 25 | 17 |
| Total Nitrogen
(µg/L) |
18 | 525 | 845 | 660 |
| Total Chlorophyll
(µg/L) |
18 | 4 | 13 | 8 |
| Water Clarity
(ft) |
18 | 3 | 5 | 4 |
Trend Over Time:
Total Phosphorus – decreasing
Total Nitrogen – decreasing
Total Chlorophyll – decreasing
Water Clarity – increasing
Site 3 – 30.4344; -87.186
| Parameter | No. of samples | Minimal Geometric Mean | Maximum Geometric Mean | Grand Geometric Mean |
| Total Phosphorus
(µg/L) |
18 | 13 | 27 | 17 |
| Total Nitrogen
(µg/L) |
18 | 433 | 778 | 579 |
| Total Chlorophyll
(µg/L) |
18 | 4 | 14 | 7 |
| Water Clarity
(ft) |
18 | 3 | 5 | 4 |
Trend Over Time:
Total Phosphorus – decreasing
Total Nitrogen – decreasing
Total Chlorophyll – slightly decreasing
Water Clarity – increasing
Summary for Bayou Texar
Longest data set in our program.
Total nitrogen is higher than any other water body sampled. Much higher at Site 1 but decreases as you head towards the mouth of the bayou. It has been suggested that the source of high nitrogen may be Carpenter’s Creek.
Phosphorus, Chlorophyll, and Water Clarity have all improved between the sample efforts of 2000-2002 and 2007-2024.
Phosphorus is lower than what has been found in Bayou Chico, but higher than Bayou Grande.
The same is the case with Total Chlorophyll.
Water Clarity improved between the sampling effort in 2000-2002 and 2007-2024 but Bayou Texar is not as clear as Bayou Grande.
The nutrient levels at Site 1 have not changed over the 15 years of monitoring.
BIG LAGOON (2020-2023)
Site 1 – 30.3087; -87.3881
| Parameter | No. of samples | Minimal Geometric Mean | Maximum Geometric Mean | Grand Geometric Mean |
| Total Phosphorus
(µg/L) |
4 | 12 | 14 | 13 |
| Total Nitrogen
(µg/L) |
4 | 159 | 277 | 218 |
| Total Chlorophyll
(µg/L) |
4 | 2 | 3 | 3 |
| Water Clarity
(ft) |
4 | 9 | 11 | 10 |
Trend Over Time:
There were only 4 samples analyzed between 2020-2024; no trend available.
Site 2 – 30.3259; -87.3535
| Parameter | No. of samples | Minimal Geometric Mean | Maximum Geometric Mean | Grand Geometric Mean |
| Total Phosphorus
(µg/L) |
4 | 10 | 15 | 12 |
| Total Nitrogen
(µg/L) |
4 | 137 | 253 | 184 |
| Total Chlorophyll
(µg/L) |
4 | 1 | 2 | 2 |
| Water Clarity
(ft) |
4 | 9 | 12 | 10 |
Trend Over Time:
There were only 4 samples analyzed between 2020-2024; no trend available.
Site 3 – 30.3242; -87.3307
| Parameter | No. of samples | Minimal Geometric Mean | Maximum Geometric Mean | Grand Geometric Mean |
| Total Phosphorus
(µg/L) |
4 | 9 | 14 | 11 |
| Total Nitrogen
(µg/L) |
4 | 145 | 284 | 185 |
| Total Chlorophyll
(µg/L) |
4 | 1 | 2 | 2 |
| Water Clarity
(ft) |
4 | 9 | 14 | 12 |
Trend Over Time:
There were only 4 samples analyzed between 2020-2024; no trends available.
Summary for Big Lagoon
This is a new location, and few samples have been collected. WE ARE SEARCHING FOR A VOLUNTEER TO MONITOR BIG LAGOON.
Though there are few samples to look at, nutrients in Big Lagoon appear to be much lower than we find in the bayous and water clarity is much higher.
Water Clarity is 10-12 feet.
UPPER PENSACOLA BAY (2019-2024)
Site 1 – 30.414; -87.1874 (near the mouth of Bayou Texar)
| Parameter | No. of samples | Minimal Geometric Mean | Maximum Geometric Mean | Grand Geometric Mean |
| Total Phosphorus
(µg/L) |
4 | 7 | 16 | 11 |
| Total Nitrogen
(µg/L) |
4 | 151 | 300 | 238 |
| Total Chlorophyll
(µg/L) |
4 | 1 | 7 | 3 |
| Water Clarity
(ft) |
4 | 7 | 14 | 10 |
Trend Over Time:
There were only 4 samples analyzed between 2019 and 2024; no trends available.
Site 2 – 30.4071; -87.1853 (half way between the mouth of Texar and the midpoint of bay bridge)
| Parameter | No. of samples | Minimal Geometric Mean | Maximum Geometric Mean | Grand Geometric Mean |
| Total Phosphorus
(µg/L) |
4 | 9 | 17 | 13 |
| Total Nitrogen
(µg/L) |
4 | 161 | 280 | 237 |
| Total Chlorophyll
(µg/L) |
4 | 2 | 6 | 3 |
| Water Clarity
(ft) |
4 | 7 | 16 | 10 |
Trend Over Time:
There were only 4 samples analyzed between 2019-2024; no trends available.
Site 3 – 30.3965; -87.18 (midpoint of bay bridge)
| Parameter | No. of samples | Minimal Geometric Mean | Maximum Geometric Mean | Grand Geometric Mean |
| Total Phosphorus
(µg/L) |
4 | 9 | 15 | 13 |
| Total Nitrogen
(µg/L) |
4 | 114 | 310 | 196 |
| Total Chlorophyll
(µg/L) |
4 | 2 | 8 | 4 |
| Water Clarity
(ft) |
4 | 7 | 17 | 11 |
Trend Over Time:
There were only 4 samples analyzed between 2019-2024; no trends available.
Summary of Upper Pensacola Bay
Like Big Lagoon, this is a new site with few samples to analyze.
Like Big Lagoon, nutrients are much lower, and water clarity much higher than the bayous.
Water Clarity 10-11 feet.
LOWER PERDIDO BAY (2014-2024)
Site 1 – 30.3239; -87.5044
| Parameter | No. of samples | Minimal Geometric Mean | Maximum Geometric Mean | Grand Geometric Mean |
| Total Phosphorus
(µg/L) |
11 | 11 | 17 | 15 |
| Total Nitrogen
(µg/L) |
11 | 266 | 390 | 318 |
| Total Chlorophyll
(µg/L) |
11 | 3 | 6 | 5 |
| Water Clarity
(ft) |
11 | 5 | 8 | 7 |
Trend Over Time:
Total Phosphorus – decreasing
Total Nitrogen – decreasing
Total Chlorophyll – decreasing
Water Clarity – increasing
Site 2 – 30. 3222; -87.4575
| Parameter | No. of samples | Minimal Geometric Mean | Maximum Geometric Mean | Grand Geometric Mean |
| Total Phosphorus
(µg/L) |
11 | 12 | 18 | 15 |
| Total Nitrogen
(µg/L) |
11 | 252 | 394 | 311 |
| Total Chlorophyll
(µg/L) |
11 | 3 | 6 | 5 |
| Water Clarity
(ft) |
10 | 4 | 7 | 5 |
Trend Over Time:
Total Phosphorus – slightly decreasing
Total Nitrogen – decreasing
Total Chlorophyll – decreasing
Water Clarity – decreasing
Site 3 – 30.3456; -87.4417
| Parameter | No. of samples | Minimal Geometric Mean | Maximum Geometric Mean | Grand Geometric Mean |
| Total Phosphorus
(µg/L) |
11 | 13 | 21 | 16 |
| Total Nitrogen
(µg/L) |
11 | 264 | 394 | 315 |
| Total Chlorophyll
(µg/L) |
11 | 3 | 6 | 5 |
| Water Clarity
(ft) |
11 | 11 | 21 | 16 |
Trend Over Time:
Total Phosphorus – remains the same
Total Nitrogen – decreasing
Total Chlorophyll – decreasing
Water Clarity – increasing
Summary for Lower Perdido Bay
The total phosphorus at Sites 2 and 3 have basically not changed in the 10 years of monitoring. This is the only body of water that has shown that.
The total nitrogen levels though not high, are higher than other open water bodies we are monitoring and higher than Bayou Grande.
Water clarity is higher than the bayous, but lower than Big Lagoon or Upper Pensacola Bay.
SUMMARY OF REPORT
Though the number of samples analyzed in the open bodies of water are lower than those within the bayous, the open waters appear to have less nutrients and clearer water. This is to be expected. Lower Perdido Bay has higher nutrients, and lower water clarity, than Big Lagoon or Upper Pensacola Bay.
As stated, the bayous have higher nutrients and lower water quality when compared to the open water bodies. Overall, Bayou Chico has higher nutrients and lower water clarity than the other bayous. Bayou Grande is in the best shape when compared to Bayou Chico or Texar. Bayou Texar has the highest levels of total nitrogen – particularly near the head of the bayou near Carpenter’s Creek.
Lower Perdido Bay has shown much improvement over the last few decades.
Bayou Chico still has the highest nutrient concentrations within the system.
Bayou Texar has the highest total nitrogen within the system, but many believe the source of this is Carpenter’s Creek.
All of this said, the nutrient levels in the bay system have improved over the past decades and we have only had one major fish kill since 2012. This was in Bayou Chico and was caused by excessively warm water decreasing the dissolved oxygen. Our volunteers will continue to monitor, and we will post another report next winter.
If you have questions concerning these data, please contact Rick O’Connor at the Escambia County Extension Office – 850-475-5230; roc1@ufl.edu.
 0
0
