Water within the Deep Blue is not something that most people think about when they are out there. Other questions like – “how deep is it?” “What’s on the bottom?” “I wonder what kind of fish are out here.” Are the typical questions. Not… “I wonder how salty it is halfway down?” But that is exactly the type of question some oceanographers have.
To understand what sort of questions they may have asked you first would look at the types of questions they would ask in the estuaries. We know that water is mostly hydrogen and oxygen. There are dissolved solids (salts) and gases (oxygen, carbon dioxide) within. We know that the amount of salt in river water is so low you cannot really detect it and so we report it as 0 parts per thousand (ppt). In the upper estuary where the river meets the bay, the salinity may run between 0-10 ppt. Midway down the estuary it may be 10-20 ppt, and in the lower estuary where it meets the sea it could be between 20-30 ppt. They also knew that the salinity of the inshore ocean was between 30-35 ppt. They also knew that the deeper you went in the estuary, the saltier it became. Maybe not by much, but the saltier water was on bottom.
This led to the question about the Deep Blue. As you moved from inshore to nearshore, and from nearshore to offshore, does the salinity increase? You would suspect that, as with the estuary, as you go deeper the salinity would increase and the temperature would decrease – but by how much? They also knew that the pH of freshwater varied over time, but not so much with estuarine water. The salts in the water buffer the pH and keep it between 7.0 and 8.0. Was this the case in the Deep Blue?
There was a chemist onboard the Challenger and those questions were in the back of his mind. But as with the geologists, how to sample? To collect surface water from the Deep Blue in 1872 was simple enough, grab a bucket and line, toss it overboard, pull it up, there you are. But of the water 5000 feet deep. How do you get water from the bottom? AND if you wanted samples every 100 feet in between, how to do that?
They did eventually develop a method to do this. It was called the water bottle. The early ones were made of brass and one of the early designers was an engineer named Nansen, this became known as the Nansen bottle. The way it worked was that you had a large cable on a winch. At the end of the cable, you would attach a large weight to help sink the line. This was carefully moved over to the catwalk and lowered over the side. You pay out 100 feet of cable and attach the first Nansen bottle. This was lowered another 100 feet and a second Nansen bottle was attached along with a heavy weight called a messenger. And so on until you had Nansen bottles set at every 100 feet to the bottom. With all of the bottles in the water you would wait for a few minutes for the thermometers that were encased in brass and attached to the bottles to adjust to the temperature at that depth. When the decision was made to close the bottles, you would attach one last messenger to the cable and send it down. When it hit the first bottle, the bottle would flip upside down grabbing water at that depth and closing the valve. The thermometer would also flip fixing the temperature at that depth. The flipping of the bottle would release another messenger you had attached to that bottle, and it would slide down the cable to trip the next bottle. And so on and so on until the final bottle was flipped. I have done this before and by placing your hand on the cable you can feel when each bottle flip and count them.
At some point the operator would give the signal to the winch operator to raise the array. As a bottle came out of the water, you would disconnect it and place it in a numbered rack so you could remember where in the water column it came from. Then the bottles were taken in and analyzed for whatever they were studying.
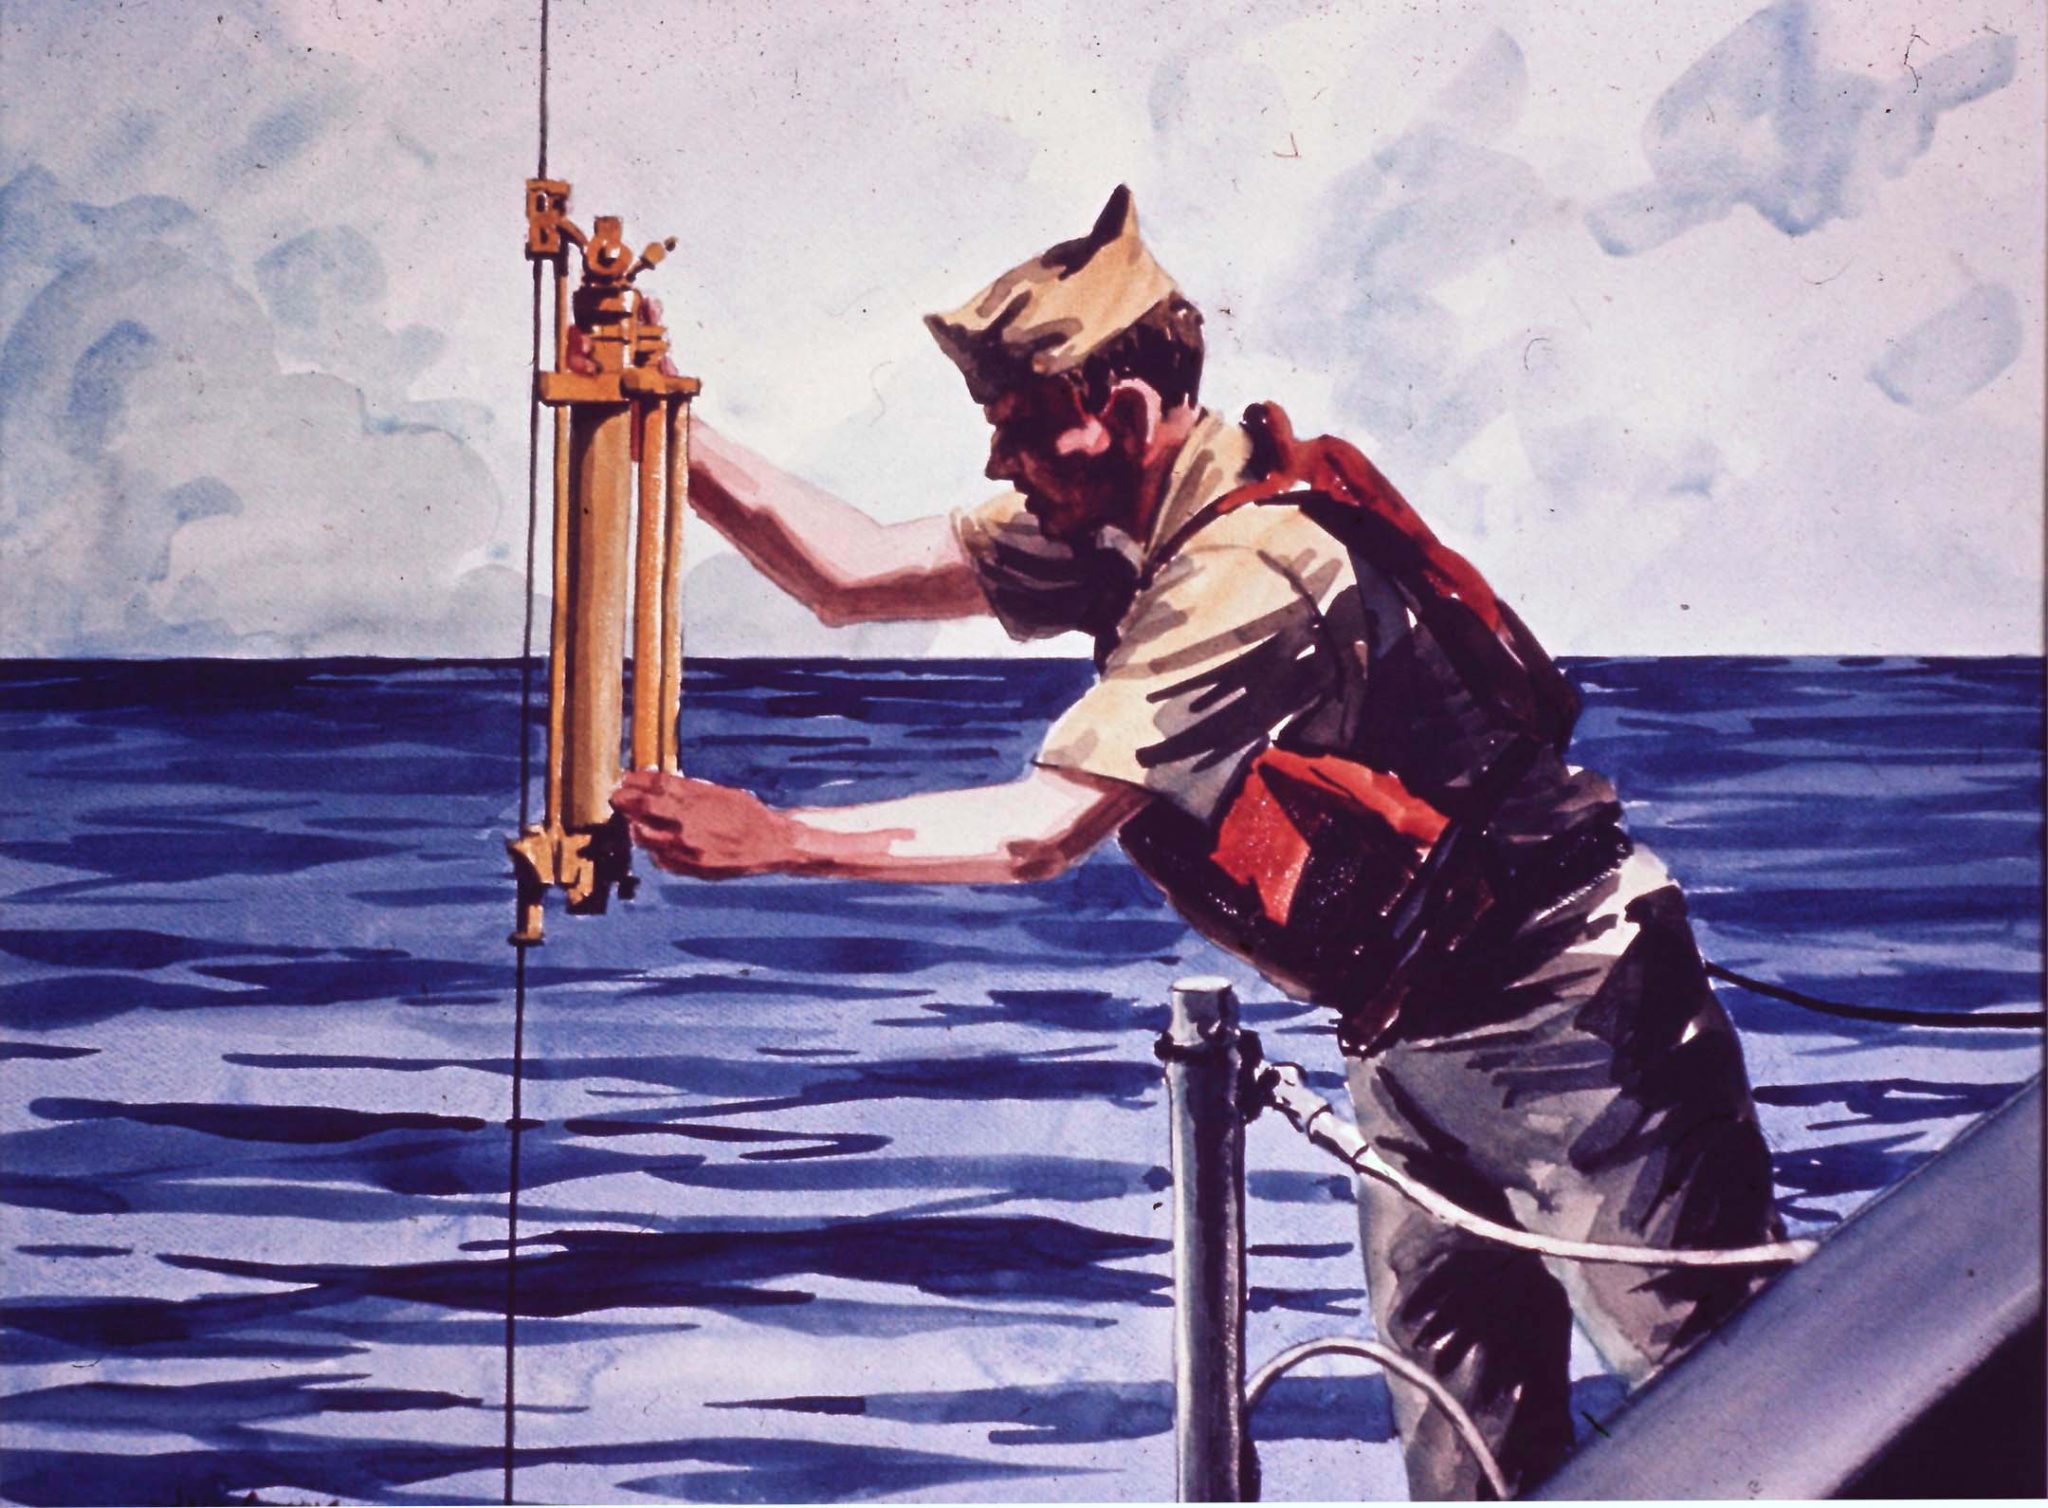
Image: NOAA
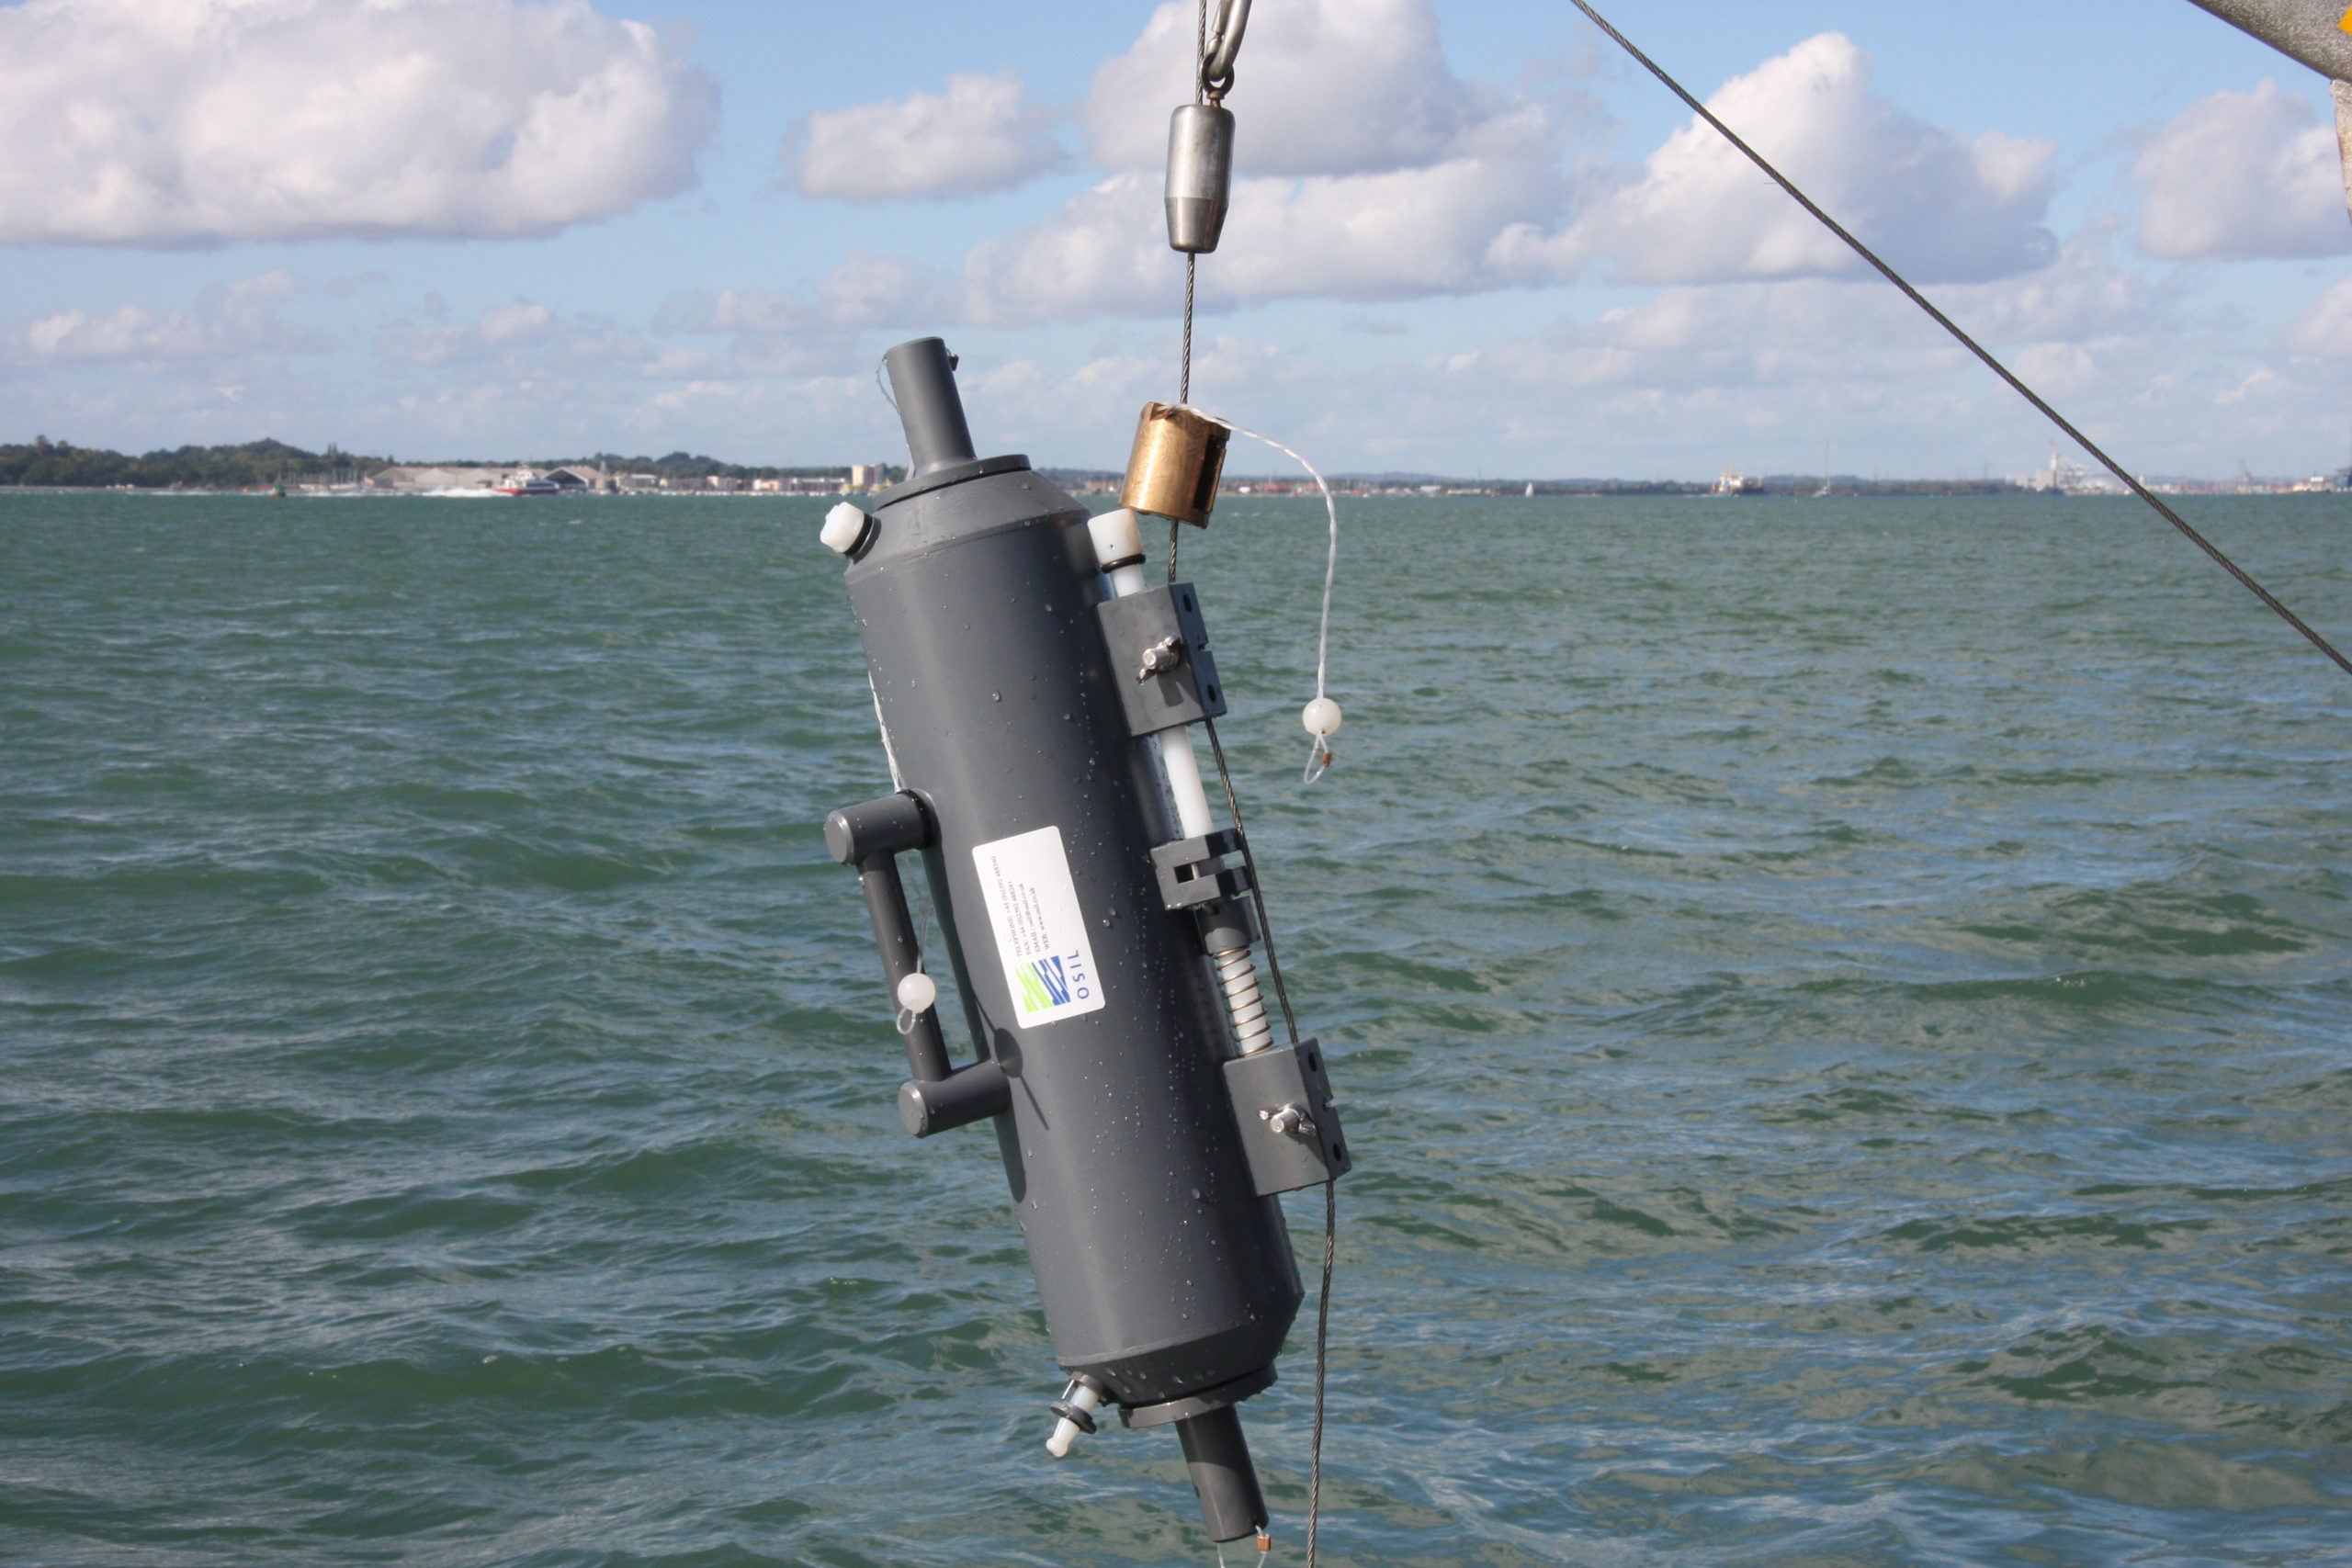
In the 1960s another engineer by the name of Niskin developed a similar system but instead of flipping, the bottle was opened at each end and the water just moved from the lower opening and out the upper. Once at the assigned depth, the messenger would close the top and bottom openings trapping water from that depth inside. Additional messengers would close additional Niskin bottles. These were also made of PVC instead of brass – so, they were much lighter and cheaper than Nansen bottles.
One interesting sea story here came from my time at Dauphin Island Sea Lab. Though we used more modern methods for sampling water (which I will explain later in this article) we were taught how to use the Niskin bottles and had a Nansen bottle to look at (we never used it). For the Niskin bottle system to work you had to have many messengers. There was a wooden box called the “messenger box” that held a lot of them. These messengers were usually stainless steel and resembled bullets to allow them to drop with enough speed to trip the water bottle when it reached it. One day we were on our way to the edge of the Deep Blue off of Alabama to do some collecting and everyone had their job. One guy was responsible for the messenger box – his name was Richard. After about an hour we reached the first station, we attached the heavy weight to the cable, swung it over the side, attached the first Niskin bottle, lowered it, were attaching the second and asked for a messenger. Richard had forgotten the messenger box… we had NO messengers. The trip was pointless, we retrieved the one Niskin we had on the line, the weight, put the cable away and steamed back to shore. We could not collect. A totally wasted day. Don’t forget the messengers!
The next advancement in water sampling involved an array for water bottles attached to a metal ring. These were basically clamped in place in a circle around the ring and numbered. Instead of using a metal messenger to close them, they were electronically tripped from on deck. The panel near the ganway into wet bay had a series of numbered buttons. The large array would be lifted by the winch (helmets and life jackets required beyond the yellow line!), swung over the side, and lowered to the first stop – let’s say 100 feet. The winch operator would call out “fire one!” and the co-operator standing by the panel would push button number 1. This would electronically close bottle number one, and then the winch operator would lower it to 200 feet – so on and so on. Once the array was back on deck it was carefully placed in a rack and you could dispense water from each bottle from a small valve. There’s your water…
Another sea story… the summer after I sailed on the “O 2” I attended the University of Miami and we conducted a short cruise into the Atlantic Ocean. The Deep Blue is very close to shore here and we could get there very fast. I was in charge of the water bottle array and on the way out I decided to test the system. With the array sitting in the wrack, I set the bottles, and called to the person by the panel “Fire 1!” – bottle number 8 closed… I reset it and called again, “Fire 1”. Bottle 8 closed again. For kicks and giggles, I called “Fire 2” and bottle number 3 closed. Holy cow. The system worked but the numbered buttons did not match the numbered bottles. So, I reset all of the bottles, called out each number, and recorded on a notebook which button went with which bottle. Number 1 is bottle 8, Number 2 was bottle 3, and so on. Life on a research vessel.
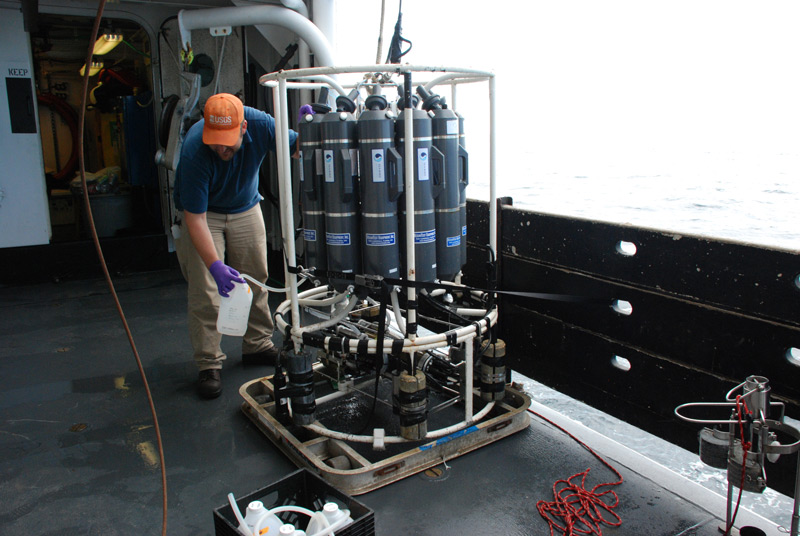
Photo: NOAA
Now it is even easier.
At Dauphin Island Sea Lab we had an instrument we called the SeaBird because that was the name of the company who designed and built it. It was a stainless steel metal frame that had multiple instruments attached. One probe measured salinity, another temperature, a third dissolved oxygen, a fourth pH, and so on. It was all powered by electricity which reached the probes via a set of electric cables that were zipped tided together and attached to the steel cable. The frame was heavy enough that you did not need any weights added when sampling in shallow water, but you could add weight if in the Deep Blue.
There was a metal bar on the side and when you slid that bar down, the instruments began collecting eight readings a second! BUT you could not slide the bar on the deck of the ship – it would begin reading at that point and the readings were not that of the ocean but of the air on the deck! So, you had to lift and swing the SeaBird over the rail of the catwalk, have the winch operator lower as close to the surface of the water as possible and still be able to reach the bar, slide the bar and tell them to lower NOW! It would slowly drop to the bottom, and was immediately raised back up. Once on deck, you would slide the bar off. You could then plug the system into a computer and get a spreadsheet and graph instantly. It took very little time to do this compared to older methods. And it did not matter if Richard forgot the messenger box, all was good.
So, what have we learned?
The salinity of the ocean does NOT increase as you move offshore as it did in the estuaries. Though it might be slightly higher – say 36 ppt in some locations and 34 ppt in others, it is generally between 30-40 ppt across the sea. This is true in the tropics and the polar waters as well. Most textbooks, probably yours, state the average salinity of seawater is 35 ppt. This has been consistent with all ocean explorations since the time of the Challenger.
As you descend from the surface to the bottom the salinity does increase – but gradually… Instead of a steady increase on your way down the salinity near the surface may range between 33-35 ppt (something like that) and – at some point in the water column – suddenly jump to 36-38 ppt. This sudden increase can be seen on a graph and that point in the water column is known as the halocline. It is the line between two different masses of water. From a water point of view, the ocean is layered like a cake, saltier on the bottom.
The temperature data shows a similar thing, though the difference is a bit more drastic. The water temperature near the surface of the Gulf of Mexico in the summer can be near 80F. As you descend you see it slowly drop and then – at some point in the water column – there is a drastic drop in temperature. Above this point it might be between 80-60F, below it can be 40-30F! The water temperature at the bottom of the Deep Blue is VERY cold. This temperature line is called the thermocline. And, as with the halocline, forms another layer of water – contributing to the cake layering of the ocean.
Early explorers noticed a difference in sea surface temperatures (SST) as well. By dropping a thermometer overboard on a line, they could tell when the SST changed from say 60F to 80F. When this happened, they knew they were in one of the major ocean currents, like the Gulf Stream. There was also a color change between these water masses that the sailors of old knew they were entering the Stream.
High saline water and cold water are more dense than less saline and warmer water. So, there is a difference in the densities of these water layers as well. Data collected since the Challenger show that, like salinity and temperature, there is a sharp increase in density at some point in the water column. This line is known as the pycnocline. And, you guessed it, forms a layer.

You would think that the halocline, thermocline, and pycnocline are all at the same depth. They are usually close to each other – but not always. And – as you will see in another Part of this series, these layers effect where the marine life will be found.
With dissolved oxygen, you would expect that it would be lower near the bottom- and it is. Oxygen is produced/dissolved into seawater from plants and the interface between the sea and air. Plants need sunlight to survive – so, you would expect higher DO near the surface – and it is.
pH is buffered by the salts of the sea just as it is in the estuaries. Typically, ocean pH runs between 7.0 and 8.0 and does not vary much. Deep sea explorers would later find some stark differences as you approached deep sea vents and smokers (another topic for another article) but have also noticed a drop in pH across the worlds oceans in recent decades. It is believed this is being triggered by increased CO2 in the atmosphere from the burning of fossil fuels. CO2 combines with seawater to form carbonic acid. This acid is decreasing the pH and is called ocean acidification. It is of great concern because many of the creatures that live in the ocean build shells of calcium carbonate (corals, crabs, shrimps, oysters, etc.) and this CaCO3 shell dissolves in acidic water. We could lose a lot of marine life if this process continues.
In Part 5 we will look at another part of the Deep Blue that most do not pay attention to – the motion of the ocean…
Sea Stories…
Eating…
Eating is something that is on the mind of all who are on an oceanic cruise. The co-operators and the crew work hard when they are on shift and burn a lot of calories. Mealtimes in the galley are set. We were told during our pre-cruise meetings that breakfast will run from 7-9am for example. It will NOT begin before or after this. And they were not kidding. My first trip to the galley for breakfast after my 4-8am shift included a large plate of bacon, eggs, etc. I was enjoying it and having conversations with others when the mess crew came out and took my unfinished plate. It was 9:00am. That’s it! SO, DO NOT MESS AROUND – EAT – or it will be taken!
Another note on the food. It was high in carbohydrates. This was because they knew we were going to burn calories and needed it. This was true for most of the crew and co-operators. But some, like the engineer down in the engine room, and the officers on the bridge, did not move much at all during their shifts. They do not make separate meals for them and I was told by the officers that if they did not watch it – they would gain weight out here. To counter that, many of them would run laps around the ship when their shifts were off. I heard the engineers had a boxing bag set up in the engine room and would punch it frequent with boxing gloves when they had a chance.
There was a refrigerator in the galley that was open 24 hours. It was full of ice cream bars!
Now that was cool!
 2
2
