Mark Twain once said – “Everyone talks about the weather, but no one does anything about it”. I guess you could say the same for climate.
The topic has been around for a while. As an undergrad science major in the late 1970s, we discussed what was then called “global warming”. It was explained to us that there were gases in our atmosphere that can cause what was called “the greenhouse effect”. Like the windows of a greenhouse, these gases allowed solar radiation to pass through to the surface of the planet but would not allow heated air to leave. Within the greenhouse it would get warmer.
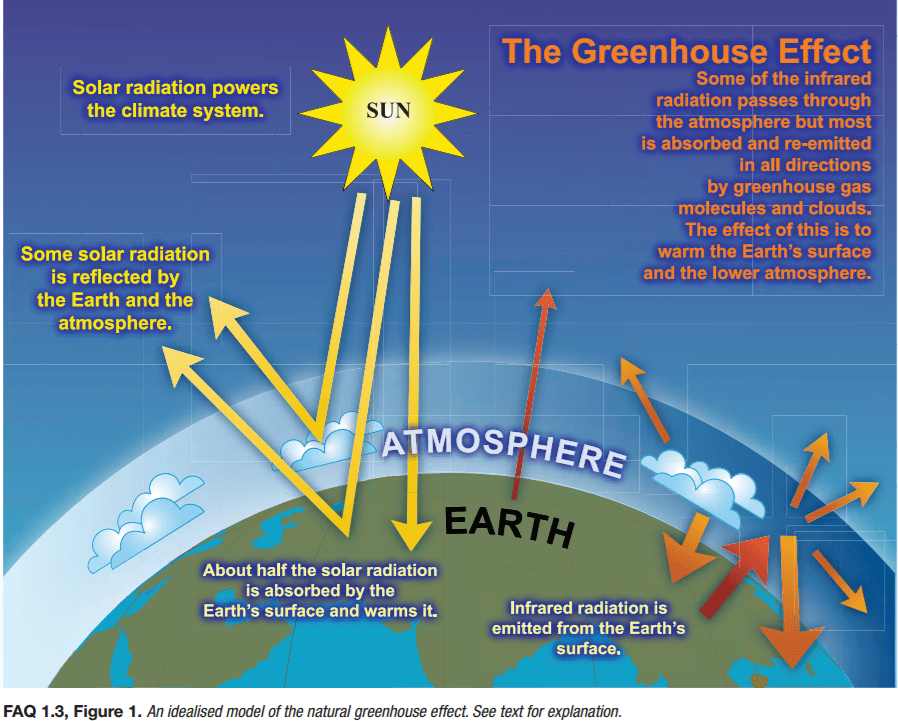
Image: NOAA
It was also explained to us that this was a natural part of the planet’s cycle. That without the “greenhouse effect” life on our planet could not exist. But it was also explained that the cycle worked like the thermostat in your home. Conditions on the planet increased the amount of greenhouse gas, which would in turn, increase the temperature of the planet. These warming conditions would enhance specific forms of life and their populations increased as well, land and sea. But like a thermostat at home, when the temperature reaches a certain point, the HAVC system shuts off and a cooling period happens within the house. The same happens on earth. Trees, and other forms of life, would increase in number during the warming periods but consume CO2 for photosynthesis and reduce the greenhouse effect leading to a cooling period. Other methods of greenhouse gas sequestration would occur as well. We know that the cooling periods could be quite significant – leading to ice ages. The species that sequestered the greenhouse gases would decline with the cooling periods allowing for an increase in those gases, and the cycle would begin again. And so it goes.
But was there any scientific evidence that such cycles actually exist?
Yes…
It is simple to construct an experiment within a closed system in a lab where you increase selected greenhouse gases to determine whether they actually increase temperatures within the systems. This has been numerous times by numerous scientific teams and the answer is yes… this happens. Science has been following this since 18961.
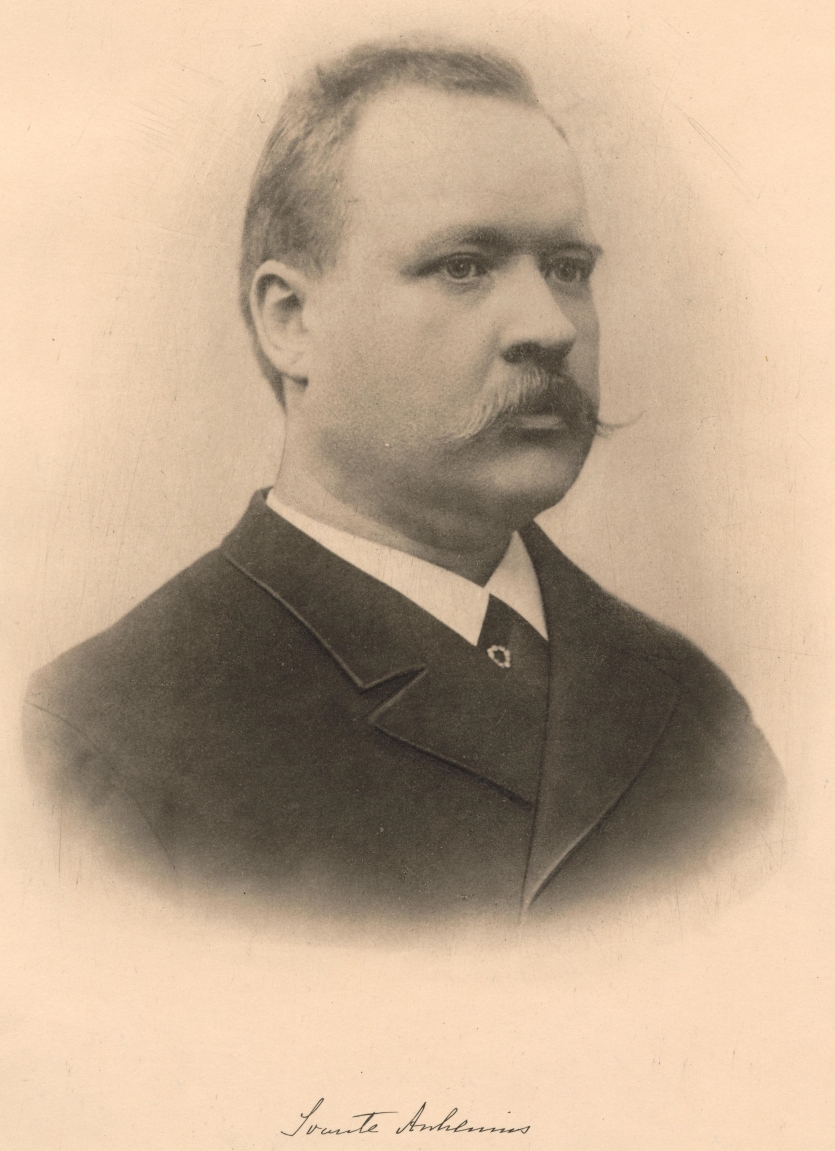
Image: Science History Institute
But is there evidence this occurs in the natural world, where there are more complex factors involved?
Yes…
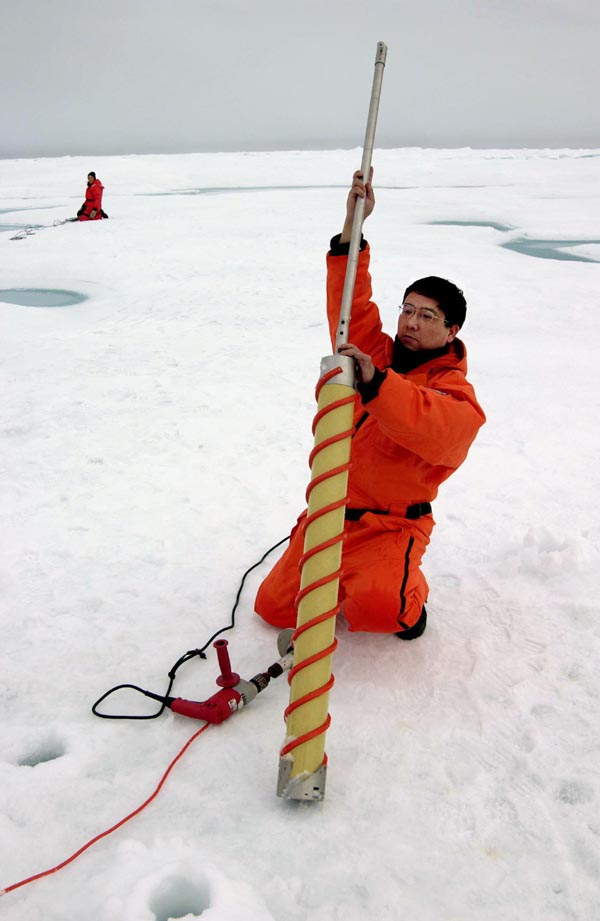
Probably one of the more notable ones were gases trapped in ice cores removed from Arctic and Antarctic ice. Geology has understood for decades that material on our planet, rock and ice, are laid down over time. You can travel anywhere out west and see these layers of different rock layered over time. The idea is that the older material is laid down first and the newer material is near the top. But we also have evidence that the world is not a stagnant place. The earth’s surface shifts and changes constantly under the stresses of plate tectonics (another topic for another day). This shifting can cause older material on the bottom to shift in an upward position, placing it at – or above – newer material. So, geologists understand that it is not as simple as “older is on bottom” and great scrutiny and study must go into “reading” the rock layers. But reading those rock layers correctly can tell you a lot about how the earth has changed over time.
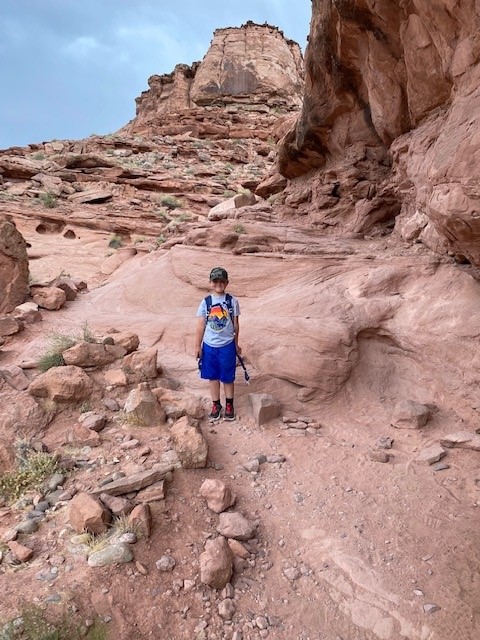
Photo: Rick O’Connor
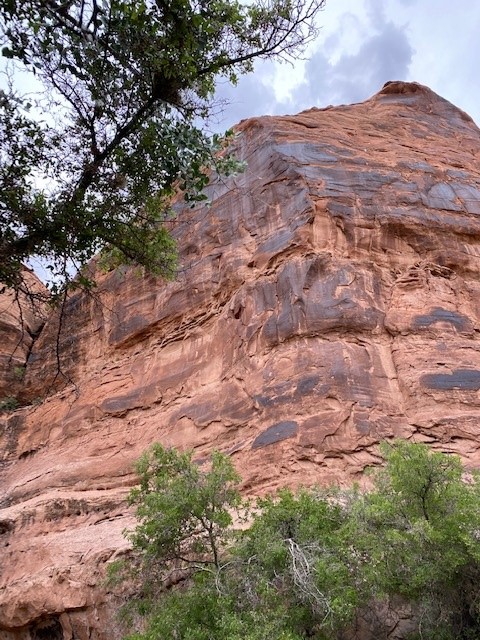
Photo: Rick O’Connor
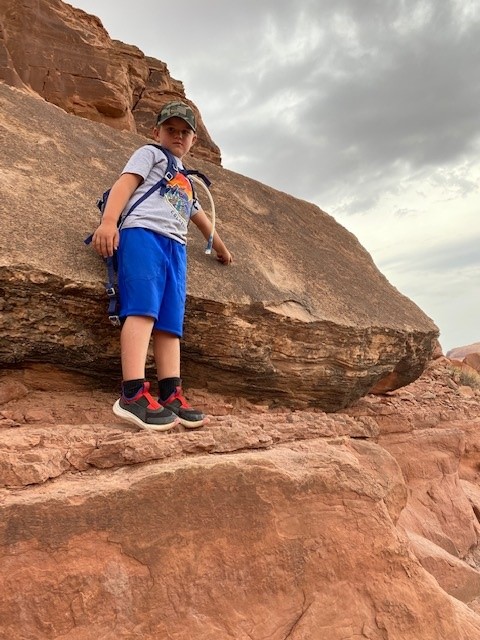
Photo: Rick O’Connor
We know that when ice forms gas bubbles are trapped inside. You can take any ice cube today and see this. Using the same concept as “rock reading”, you can read layers of ice that are cored from the great ice sheets at the poles. Analyzing these gases, you can get an idea of the concentration of the greenhouse gases present at the time the ice formed. You can compare this to the fossilized plants and animals (even fossilized pollen) of those same periods and put together a map of the concentration of greenhouse gases, what the expected temperatures would have been based on those concentrations and compare this to the plants and animals that existed during that same time (were they warm or cold seasoned creatures). With this you could develop a map of the changing climate over time.
There is data going back over the last 900,000 years and yes… there are cool and warm periods found. One graph published by Miller and Spoolman (2011)1 shows average surface temperatures ranging from 9°C to 16°C (48°F to 61°F) over the last 900,000 years. The graph shows a basic “sine wave” of steady cooling and warming – a steady pattern – a cycle. Miller and Spoolman referred to these cycles as glacial and interglacial periods (freezing and thawing).
So, the lab and field evidence suggest we do live on a planet with ever changing climate. We are currently in a “thawing” period, and all is right with the world. But the data shows something else. Something that has climate scientists a bit concerned. Over the last 1000 years there has been a steady increase in surface temperatures, which was expected, but over the last 100 years there has been an unusual spike in increasing temperatures, something that have not seen in all of the data studied before. A rapid increase in surface temperature. What could be causing this unusual steep increase, and can the natural sequestering processes mitigate this rapid change?
Image: NOAA
If you examine a graph of temperature change over the last 1000 years you will notice the unusual spike beginning about the year 1900, 120 years ago. What could have happened to generate this spike?
Did the concentrations of greenhouse gases increase at the same rate during this time period?
Yes… they did.
What could have happened to cause this unusual increase in greenhouse gases and surface temperatures? And why has the natural sequestering process to cool the planets “thermostat” not kept up?
Back to the lab and to the field.
One event stands out… the industrialization of the planet. The industrial revolution began almost 300 years ago. We moved from burning wood as a source of energy to coal, and eventually oil. The burning of these fossil fuels significantly increases the same types of gases as the planet’s greenhouse gases (carbon dioxide CO2, methane CH4 and others). By the turn of the century (1900) the fossil fuel boom was in full swing. Industry and transportation were burning more and more of these fuels emitting more and more of the greenhouse gases that we know warm the planet up.

Photo: Flickr
But what about the sequestering processes of the forest and the oceans?
We began removing the forest. As the human population grows there is a need for more land for agriculture and homes/cities to live in. All across the planet deforestation was also in full swing, and agriculture/cities used fossil fuels as well. The change was on. Science has been able to determine that the carbon dioxide concentration has risen from 280 ppm at the beginning of the industrial revolution to 384 ppm in 20071. A study conducted by Field and Marland (2007) suggested that if the rate of CO2 increase at that time (3.3% annually) continued, it would reach 560 ppm by 2050 and 1390 ppm by 2100. This would have a significant impact on the climate which would in turn have a significant impact on the ecology and economics of our planet.
There was deep concern over this in the scientific community. They began developing computer models that could predict the changes in temperature with increased rates of greenhouse gases and how those could impact glacial melt, sea level rise, and atmospheric conditions that stimulate our weather. It is understood that models are only as good as the data you provide. We have learned this with hurricane models. There are numerous computer models that predict the landfall of hurricanes. The climatologist inputs what data they can get, and the model predicts where the storm will probably go – and at what intensity it will probably hit land with. These are the classic “spaghetti” models we are all familiar with on the evening weather. With hurricanes it is pretty easy to test your model. You input the data – predict landfall and intensity – and see what happens. You will get results very soon. You will notice on the evening weather that not all models make landfall at the same location. Some models are better than others. For those that were wrong, you go back and determine what information was not inputted, or inputted incorrectly, and “fix the model”. Because of this we feel very good about our hurricane models.
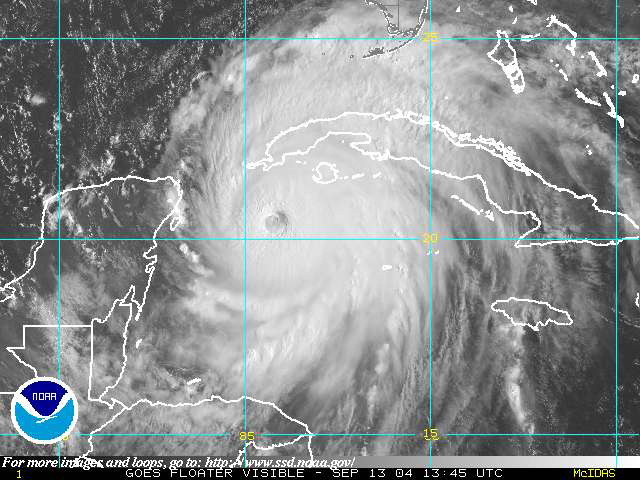
Image: NOAA
But with climate, the results of the “landfall” will not happen in hours or days – it will be years or decades. So, as the models were developed in the early 1980s, no one knew for certain whether they were accurate or not.
But that did not stop climate scientists from developing them. There was much concern in what they thought might happen. Some studies suggested that the “tipping point” (the point of no return) for CO2 admissions was 450 ppm1. Their concern was CO2 at, or above, this value could have consequences that could be irreversible for long periods of time – for some, they may never recover. This means even if we brought CO2 emissions down to almost zero, we would still feel the effects for years – a lag effect, and some impacts may not be corrected. And CO2 is only one of the greenhouse gases – there were several others that needed to be watched and analyzed as well. This concerned many scientists as well. Was anyone paying attention?
Enter the IPCC…
In 1988 the United Nations and the World Meteorological Organization established the International Panel on Climate Change (IPCC). This panel consists of over 2500 climatologists from over 130 countries. Their 2007 report was based on more than 29,000 sets of data collected over that last decade. It was stated in this report that there was high probability (90-99%) that the lower atmosphere of the planet is warming and that human activities were responsible for most of this. They cited multiple layers of evidence to support this statement.
This report stated that a rise of 2°C (3.6°F) over 2005 temperatures is unavoidable, and an increase of 3°C (5.4°F) is likely during the next century. Their models suggested the possible outcomes of such climate change.
At a 2°C increase1
- Forest fires worsen
- Prolonged droughts become more intense
- Major heat waves become more common
- Conflicts over water supplies will increase
- Modest crop production increases in temperate regions
- Crop yields fall in tropical Africa
- Coral reefs will be impacted by bleaching
- Glaciers melt faster and impact water supplies for some
- Sea levels will rise and initiate coastal flooding issues
- Malaria will increase
- Arctic species will experience an increase in extinction
At a 3°C increase1
- Forest fires get worse
- Prolonged droughts get worse
- Deserts spread more
- Major heat waves will increase, and associated deaths with them
- Irrigation and hydroelectric power declines
- Water shortages for billions of people
- Water wars and terrorism increase
- Malaria and tropical disease will spread
- Crop pests will multiple
- Coral reefs severely threatened
- Arctic tundra will melt
- 20-30% of the species will face extinction
We discussed how many climate models need time to be tested. It was 30 years between the time I first heard about “global warming” and the publication of the 2007 IPPC report, and another 10 years since that report came out. Do any of the predictions in the list above look familiar? Could these models be on the right course, as we learned with hurricane models – could these be correct?
If so, “no one is doing anything about the weather” – but are we doing anything about the climate?
In the next edition – The Changing Climate: Part 2 – we will look what has happened since 2007. How have things changed in the last decade? Are things getting better?
Reference
1 Miller, G.T., S.E. Spoolman. 2011. Living in the Environment: Concepts, Connections, and Solutions. Brooks and Cole Publishing, Belmont CA. pp. 659.
 0
0
