The summer and fall months are when a majority of producers are selling spring-born calves or yearlings from last fall. Due to the increase in supply of calves, prices typically decline during these months. We are seeing this now in Florida and all across the country, but what will happen after the fall? How is this year different from past years?
How we can visualize seasonality trends
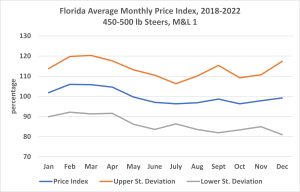
The first graph shows the average monthly price index for 450-500-pound steers in Florida from 2018-2022. This graph is simply a visual to show how we know the current dip in prices is normal during the fall. The price index (blue line) shows the relationship between each month’s average price and the annual average price. When the price index is above 100%, that means average prices in that month, on average, are higher than the annual average, (spring). When the price index is below 100%, that means average prices in that month are lower than the annual average, (fall). The orange and gray lines in Graph 1 are used to show the approximate range of variability during that month. For example, during 2018-2022, average October prices were 96% lower than the annual average. But there was variability where prices ranged between 83% and 109% of the annual average for October.
Knowing the price indices and price variability ranges creates the opportunity to estimate price projections based on what happened in the past. By dividing the future month’s average index by the current month’s average index and then multiplying by the current average price, a price projection can be calculated. For example, if October (index of 0.96) prices for feeder cattle in Florida are $250/cwt, the price projection for March (index of 1.06) would be:
(1.06/0.96)*$250 = $276/cwt
The price variability for March is calculated to be 14.52. So, there is a 68 percent chance that prices in March would fall between $261.48/cwt and $290.50/cwt.
$276 + 14.52 = $290.50/cwt and $261.48/cwt
Graph 1.Florida Average Monthly Price Index

Then vs. Now
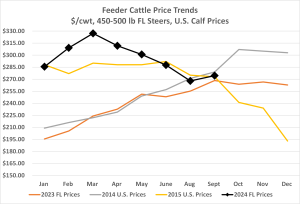
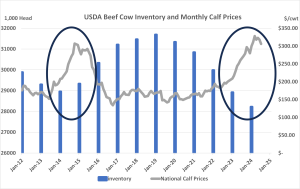
Now, the first graph only represents 2018-2022, not 2023 when prices were transitioning from a low point to a high point. The second graph shows how this transition period did not follow the typical seasonality trend (orange line). Prices continued rising into 2024, but then began falling as previously mentioned and much like we saw in 2015. However, the difference to notice between 2024 and 2015 is inventory levels and the rate of expansion (Graph 3).
Graph 2.Feeder Cattle Prices in Florida
In 2015, expansion had already started when prices were at the levels we are seeing today. There was no incentive for prices to climb back up after the typical dip in the fall. In the current market, we have not starting expanding and have already hit record prices that we saw back in 2015. This indicates that while we are experiencing some seasonality this year, it is not expected that we are headed for a continuous low level of cattle prices.
Graph 3. U.S. Beef Cow Inventory and National Prices

For more market updates like this one each month, see https://rcrec-ona.ifas.ufl.edu/about/directory/staff/hannah-baker/ under the tab “Florida Cattle Market Update”.
 0
0
