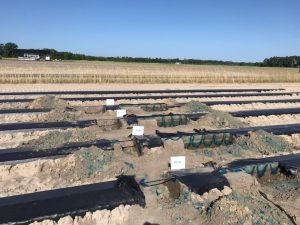
Injecting blue dye into drip irrigation systems as a way to test and visualize water and nutrient movement in soil has been used for 30 years in the Suwannee Valley of North Florida (UF/IFAS EDIS Publication HS222). The movement of water alone in soil is difficult to see and measure without sensor technology. Injecting blue dye into drip irrigation systems, followed by varying lengths of irrigation events, vividly shows how water moves through the soil. Research has also correlated blue dye movement with soluble sources of nitrogen and potassium fertilizers. That research proved that blue dye and soluble sources of nitrogen and potassium move through the soil solution at the same rate. This helps to demonstrate the impact of leaching irrigation events on nutrient losses. Over the years, the method for implementing blue dye tests has been refined into a simple, effective system and is now considered one of the most impactful Extension demonstrations for teaching irrigation management. After three decades of demonstrations across North Florida, these blue dye tests have revealed consistent patterns and valuable insights.
Lessons from Decades of Blue Dye Testing
The results of blue dye demonstrations are undisputable. The vivid visualization has led to the well-known saying, “The Blue Dye Don’t Lie.” Over the years, this phrase has proven true time and again as growers see for themselves how water and nutrients move through the soil. It is important to note that not all dyes behave the same way. Agricultural blue spray marker dye, available from most agricultural chemical suppliers, is recommended because it has the correct solubility and movement in soil.
Two of the most important decisions an irrigation manager must make are when to start an irrigation event and how long to run it. The blue dye test helps answer the second question by showing how long irrigation should run once an event has begun.
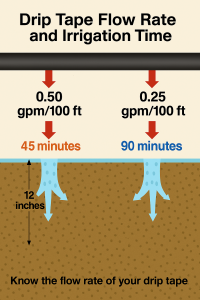
The flow rate of the drip tape is critical to understand and should be correlated with irrigation time. Drip tape flow rates can vary from 0.20 to 0.50 gallons per minute (gpm) per 100 feet. For example, if it takes 45 minutes for a 0.50 gpm per 100 ft tape to reach a 12-inch depth, a 0.25 gpm per 100 ft tape will generally take about twice as long. This highlights the importance of knowing the flow rate of your drip tape. In addition, growers should be familiar with their drip tape’s specifications, including flow rate per 100 feet per minute, flow rate per emitter per hour, and emitter spacing as these factors all influence water movement.
Emitter spacing has also been an important focus of blue dye demonstrations. Research at both the University of Florida and Clemson University found that in deep sandy soils, an 18-inch emitter spacing is too far apart because the wetting patterns do not meet, while an 8-inch spacing is too close, causing quicker saturation and an increased risk of leaching. Both programs concluded that a 12-inch emitter spacing is typically ideal for deep sandy soils, such as those used for watermelon production in North Florida.
Using a standard high-flow drip tape (0.40–0.50 gpm per 100 ft or 24–30 gallons per hour per 100 ft) has shown that water moves very quickly in these sandy soils. After dozens of blue dye tests, we know that at these flow rates, water will move 8 to 12 inches deep within 45 to 60 minutes of irrigation. This time measurement starts after the system is fully pressurized, since the pressurization period is not considered part of the effective irrigation time.
Another consistent finding is that water rarely moves more than about 7 inches laterally from the emitter. This means it is nearly impossible to wet the full width of a bed, even relatively narrow ones about 24 inches wide. Long irrigation events designed to wet the shoulders of a mulched bed simply do not work and will result in significant leaching first. Several research trials have evaluated pulsing events and the use of surfactants to try to improve the width of wetting patterns, but none have been successful, “the sand wins.”
Blue dye tests also clearly show how vulnerable deep sandy soils are to leaching, especially early in the season when little or no root system is present. During the middle and later parts of the season, when a strong root system has developed, the risk of leaching decreases. Blue dye movement observed at the peak of the season is typically less because water uptake by the root system pulls away some of the soil moisture during irrigation events.
In recent years, blue dye results have been compared with data collected from soil moisture sensors installed at multiple depths. These comparisons have shown that the wetting patterns revealed by the dye match what the sensors record. The difference is that while the blue dye shows how far water moved at one moment in time, modern soil moisture sensors provide that same information continuously, in real time, and without the digging or the blue-stained hands.
Finally, blue dye tests can also be used to visualize water movement under overhead irrigation systems. In these demonstrations, a watering can is used to distribute the dye solution evenly over an area about 5 to 10 feet square, providing a clear picture of how irrigation water infiltrates and spreads across the soil surface.
A Lasting Impact
After 30 years of use, the blue dye test remains one of the most effective Extension demonstrations for teaching irrigation management. It provides a simple, visual, and powerful way to understand how irrigation timing, duration, and system design affect water movement and nutrient losses in sandy soils. The lessons learned from these demonstrations continue to shape how Florida growers manage irrigation more efficiently, conserve water, and reduce nutrient leaching.
Authors: Robert Hochmuth¹, Tatiana Sanchez-Jones², and Sydney Williams¹
¹UF/IFAS North Florida Research and Education Center – Suwannee Valley
²UF/IFAS Extension Alachua County
 1
1
