Hurricane Idalia flood predictions
The Resilient Cedar Key project team has generated new flood depth prediction maps for Hurricane Idalia. These maps are generated from models created during a recent flooding vulnerability assessment. These maps are for informational purposes only. They can provide general insights into areas that may be more or less vulnerable to flooding. Do not use these maps for decision-making! It is important to follow all evacuation orders and safety guidance from officials. These maps do not take into account wind or wave action effects. Several scenarios are provided based on surge predictions of 7-11 ft above ground level and a landfall at low tide vs. high tide. Surge estimates have already been revised upward since these maps were created, and may be revised again.
How to view
Download scenario maps for Cedar Key here (pdf, 2.5 MB)
Download scenario maps for Rosewood area here (pdf, 37 MB)
View the interactive tool at https://resilientcedarkey.web.app/
View summary of predicted impacts from Category 3 storm to Cedar Key community assets here (pdf, 1.8 MB)
View summary of predicted impacts from Category 1 storm to Cedar Key community assets here (pdf, 4.3 MB)
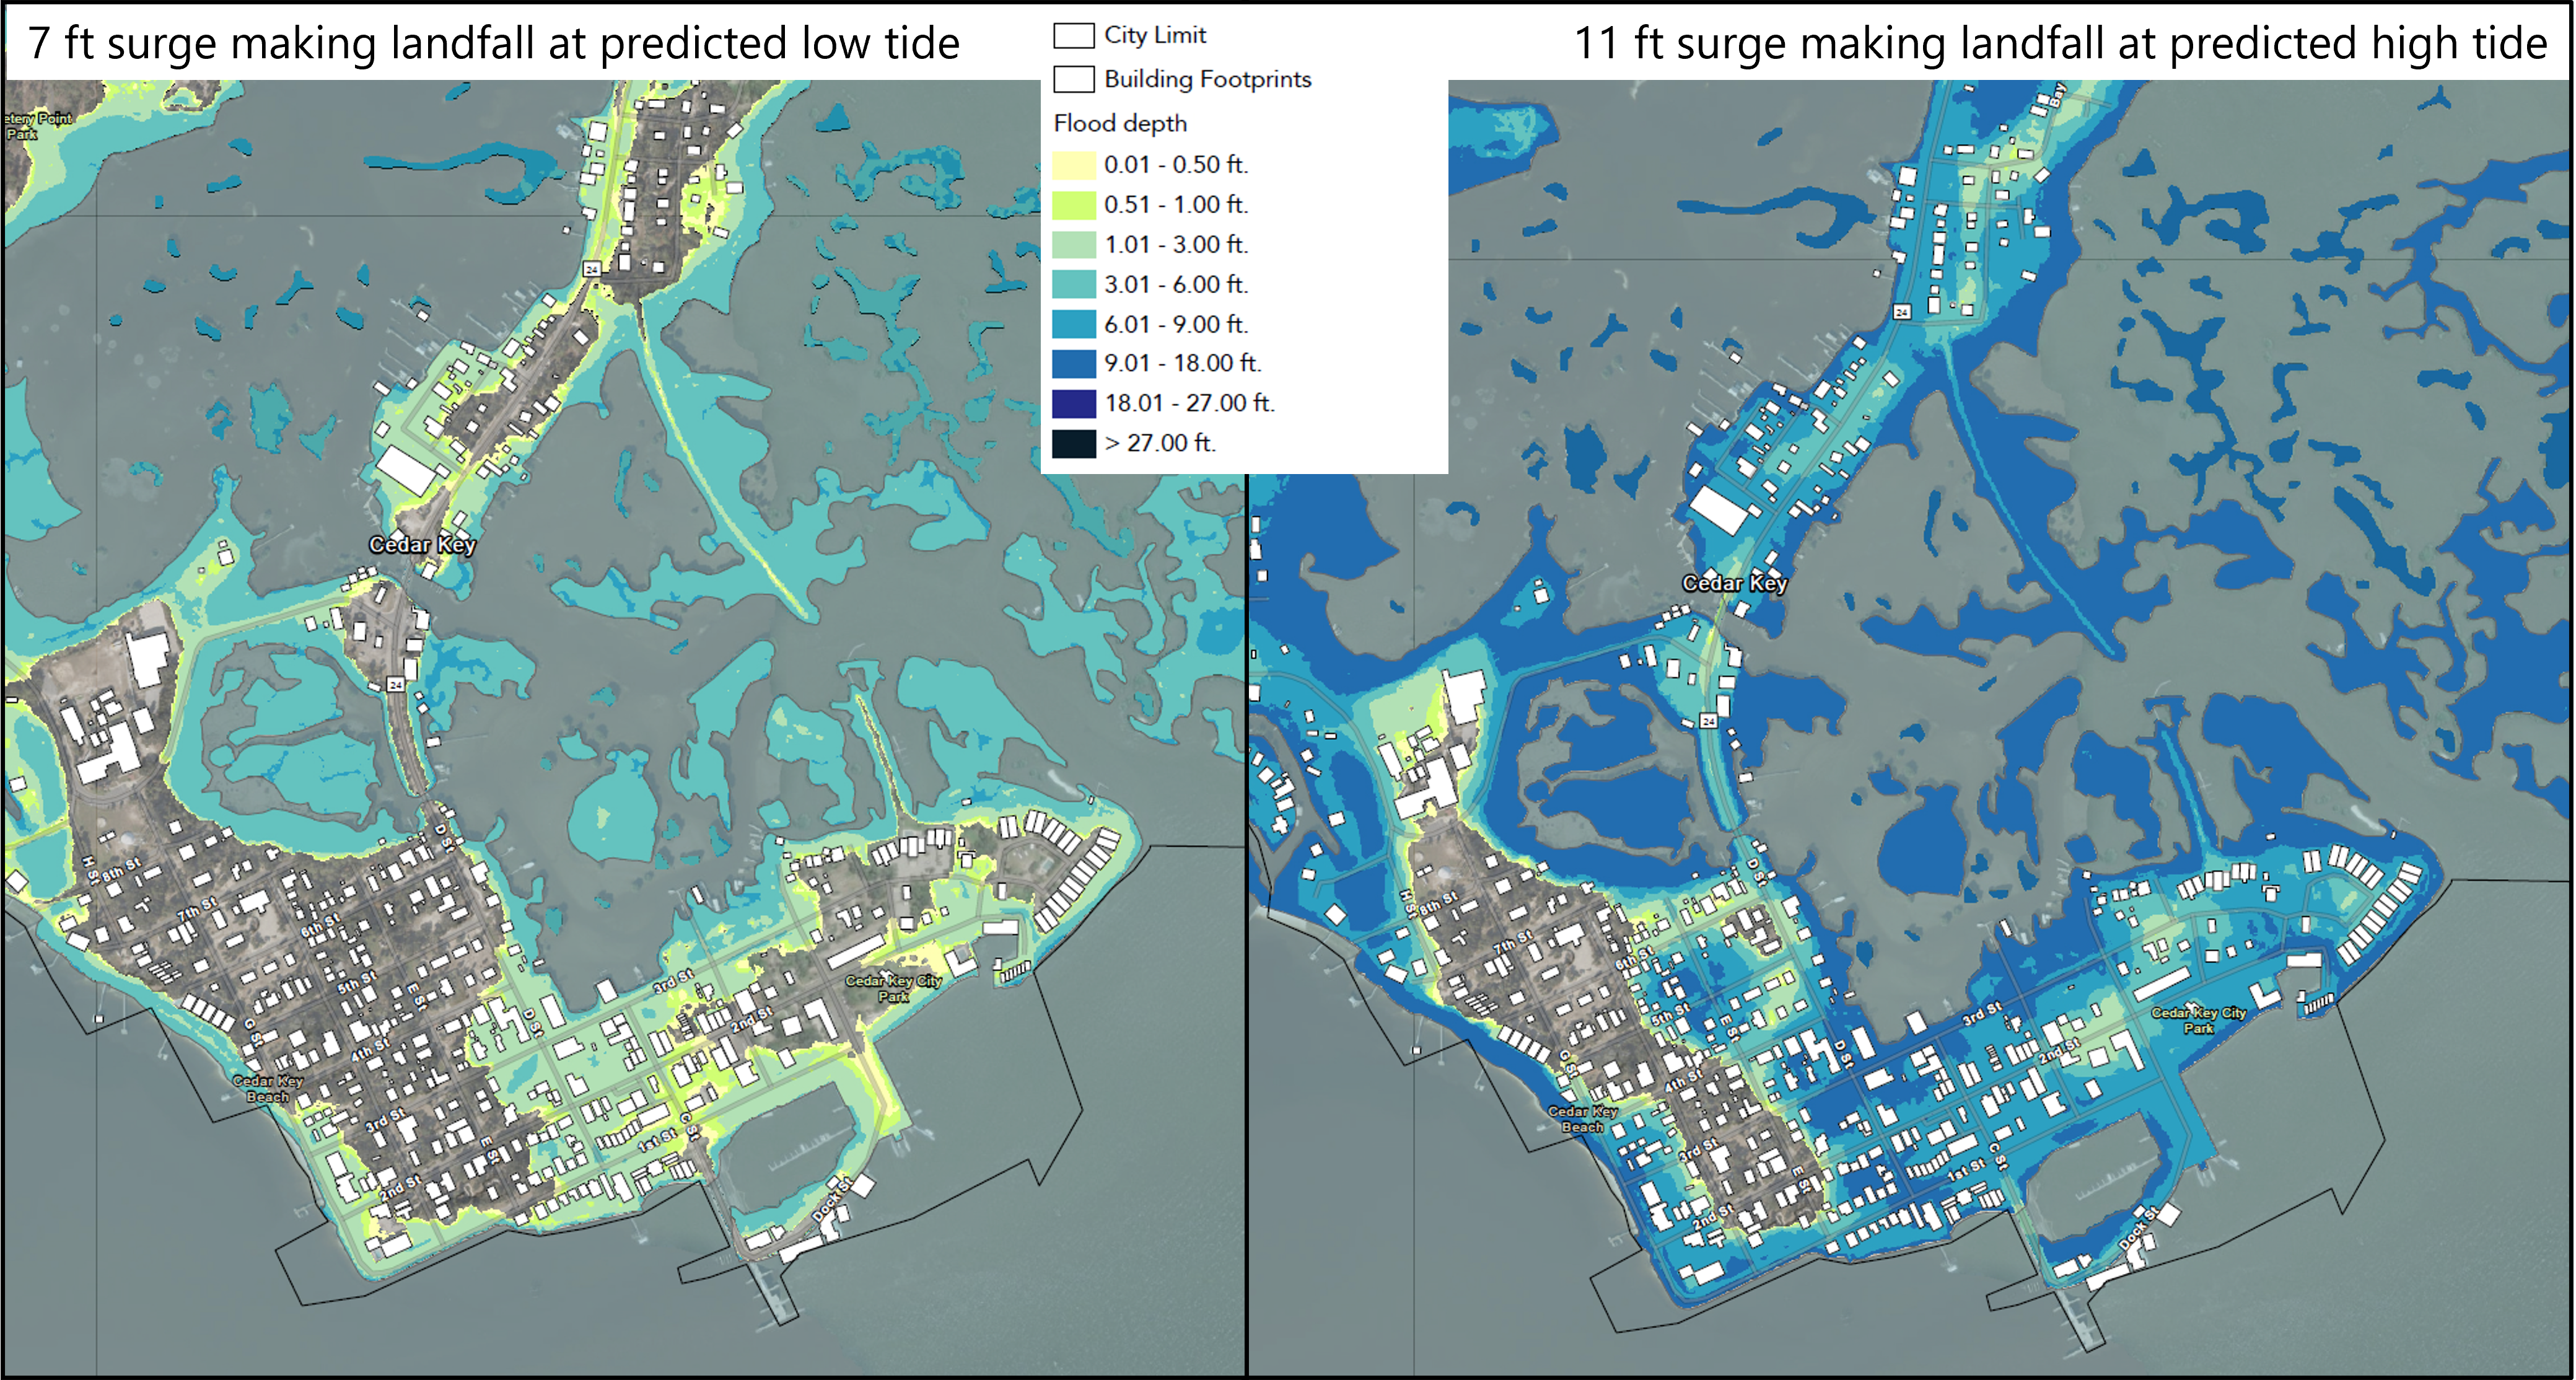
Effect of tides
Based on current guidance, Hurricane Idalia is predicted to make landfall near the lower end of the tidal cycle. However, changes in speed or track could change the timing of surge. August high tides in Cedar Key are some of the highest tides of the year and in the shallow Big Bend coast wind effects can swamp out tidal effects. As the predictions below show, the tide could have an effect on flooding impacts.
 1
1
