By: Emma Matcham, Lakesh Sharma, George Hochmuth, and Anthony Drew
An on-farm fertilizer demonstration project was conducted in 2014 on a field in Levy County to assess the impact of reducing fertilizer application rates on grain corn yield and nutrient accumulation and use efficiency. Three fertilizer treatments were chosen to illustrate different N, P, and K management strategies. One treatment was the Grower Standard Practice (363N-116P2O5-338K2O) on one-half of the 140-acre pivot irrigated field. Other treatments were Reduced N (321N-116P2O5-338K2O) and Reduced NPK (255N-78P2O5-219K2O) (nutrient rates shown in lbs / acre; treatment layout shown in Figure 2). This blog post is an overview of the demonstration project and introduces the concept of calculating nitrogen use efficiency.
Background
Water quality is crucial to protect in Florida since surface and ground waters provide many benefits, including economic benefits from tourism and recreation, ecological benefits, drinking water, and irrigation water. Nonpoint sources of, including agricultural fields, are the greatest source of pollution in the US overall and threaten Florida’s natural springs (Borisova et al., 2014). The Florida Department of Environmental Protection (FDEP) has determined that farm fertilizer is the greatest contributor to N loading in the Suwannee River basin, and corn production is one of the greatest users of N. There is great potential to reduce N application on corn in the region, which could help agriculture meet the goal of lowering N application by 4 million pounds (Hansen, 2018).
Under Florida state statutes, part of the mission of the University of Florida Institute of Food and Agricultural Sciences is conducting research and demonstration projects to develop and improve nutrient management systems as a part of the state’s Best Management Practices (BMPs) program. Best management practices are individual or a combination of practices that, based on research, field-testing, and expert review, have been determined to be the most effective and practical means to maintain and improve nutrient management and water quality. Research trials help us develop new BMPs, and demonstration trials help us communicate the value of following BMPs to farmers, agronomists, and other Floridians.
Demonstration Objectives
The objectives of this on-farm demonstration project were to (1) evaluate corn responses to several fertilization management practices and (2) determine the effectiveness of research-based N BMPs for maintaining grain yield. When the plots were established, the N recommendation was 210 lbs/ acre for any plant population.
Note: At the time of publication, the N rate recommendations vary based on plant population: 240 lbs/ acre for 30,000 plants per acre, 210 lb/acre for 25,000 plants per acre, and 180 lb/acre for 20,000 plants per acre.
Corn Establishment
This demonstration was conducted in a 140-acre field irrigated with a center-pivot system on a commercial grain farm in Levy Co. Various soil series were represented in the field, including Candler sand and Otela and Shadeville fine sands. The grain corn was planted from March 28-30, 2014, at 37,000 plants per acre in a twin-row pattern with 7 inches between rows in the twin pair and 30 inches between the center of one twin pair to the next. There were 34 inches between the twin-rows on either side of the tire tracks.
Fertilizer Applications
The entire field received an application of broiler poultry litter at 1.5 tons/acre approximately one month before corn planting (Table 1). Subsequent dry fertilizer applications and fertigation applications differed among treatments. In the Grower Standard Practice, nutrient application totaled 363N-116P2O5-338K2O. The Reduced N treatment included the same fertilizer as the Grower Standard Practice with the exception of the 5th application of N in the center pivot, which was omitted. Total nutrient applications in the Reduced N treatment were 321N-116P2O5-338K2O. The Reduced NPK treatment differed from the Grower Standard Practice in that potassium chloride (KCl) was applied pre-plant and at V6 in place of the dry N-P-K blend preplant and the NK blend at V6. Further the 5th application of N in the center pivot was omitted (255N-78P2O5-219K2O). Layout of all three treatments is provided in Figure 1.
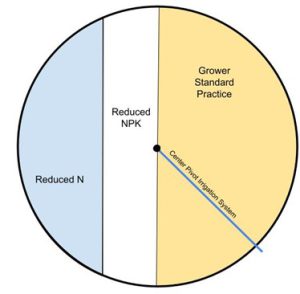
Table 1. Fertilizer rates (lb/acre) and timings for each treatment used in the on-farm demonstration trial.
| Treatment Name | Fertilizer Form | Pre-Plant N | Pre-Plant P | Pre-Plant K | At-Plant N | At-Plant P | V6 N | V6 K | Center Pivot N application 1 | Center Pivot N application 2 | Center Pivot N application 3 | Center Pivot N application 4 | Center Pivot N application 5 | Total N Rate (lb/acre) | Total P2O5 Rate (lb/acre) | Total K2O Rate (lb/acre) | ||
| Grower Standard Practice | Poultry Litter* | 39 | 39 | 39 | 0 | 0 | 0 | 0 | 0 | 0 | 0 | 0 | 0 | 39 | 39 | 39 | ||
| Dry Fertilizer | 49 | 38 | 140 | 48 | 48 | 19 | 160 | 0 | 0 | 0 | 0 | 0 | 116 | 87 | 300 | |||
| Fertigation | 0 | 0 | 0 | 0 | 0 | 0 | 0 | 42 | 42 | 42 | 42 | 42 | 210 | 0 | 0 | |||
| TOTAL: | 363 | 126 | 339 | |||||||||||||||
| Reduced N | Poultry Litter* | 39 | 39 | 39 | 0 | 0 | 0 | 0 | 0 | 0 | 0 | 0 | 0 | 39 | 39 | 39 | ||
| Dry Fertilizer | 0 | 0 | 90 | 48 | 48 | 0 | 90 | 0 | 0 | 0 | 0 | 0 | 48 | 48 | 180 | |||
| Fertigation | 0 | 0 | 0 | 0 | 0 | 0 | 0 | 42 | 42 | 42 | 42 | 0 | 168 | 0 | 0 | |||
| TOTAL: | 255 | 87 | 219 | |||||||||||||||
| Reduced NPK | Poultry Litter* | 39 | 39 | 39 | 0 | 0 | 0 | 0 | 0 | 0 | 0 | 0 | 0 | 39 | 39 | 39 | ||
| Dry Fertilizer | 49 | 38 | 140 | 48 | 48 | 19 | 160 | 0 | 0 | 0 | 0 | 0 | 116 | 87 | 300 | |||
| Fertigation | 0 | 0 | 0 | 0 | 0 | 0 | 0 | 42 | 42 | 42 | 42 | 0 | 168 | 0 | 0 | |||
| TOTAL: | 321 | 126 | 339 | |||||||||||||||
*All poultry litter was from broiler chickens and contained 2% N, 65% of which was available within the crop year.
Sampling Methods
Corn plant growth and N uptake were tracked through the season by taking whole-plant samples in each treatment area. Six random sampling sights were identified in each of the three treatment areas, and each site was identified with GPS coordinates and flags so that samples for each of the six sampling dates would come from the same general GPS area to reduce soil variability influences. Whole plants were collected at each sampling site from a 6-ft length of row from one of the rows in the twin-row. This sample was typically 6 or 7 plants. Plants were cut at the soil level. Sampling was done at the following growth stages: seedling V3 (April 22, 25 days after planting DAP), V6 (May 1, 30 DAP), V12 (May 14, 45 DAP), VT (May 28, 60 DAP), R3 (June 18, 80 DAP), and R6 (July 11, 105 DAP – near harvest).
During the last sampling date (July 11), separate ear samples were collected from different 6-ft sites to compute yield. All samples were dried, and the kernels were removed from the cobs to estimate yield. These treatment yields were compared with the farmer’s combine yields (15% moisture). After using kernel weights to estimate yield, kernel samples were used for subsequent nutrient analyses.
Corn was harvested by commercial combining on July 27. Grain was collected in trucks, and trucks were weighed on commercial truck scales. A GPS unit was used to measure the 10- acre harvested area in each of the 3 treatment areas, and the measured area and truckload weights were used to calculate corn yield.
Nutrient analyses were performed on all plant samples from all sampling dates, including the kernel samples used to estimate yield in the 6-foot plots. Total N content (Total Kjeldahl method) was measured in all plant samples. All “ear-leaf” diagnostic samples collected at VT were analyzed for N, P, and K content, and results were compared to tabulated nutrient sufficiency values to test for any nutrient deficiencies associated with fertilizer treatments. Season-end whole-plant samples collected for R6 were also analyzed for P and K, in addition to total N.
Data Visualization
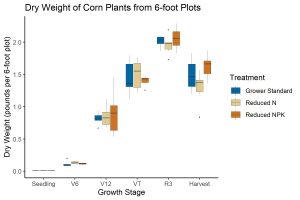
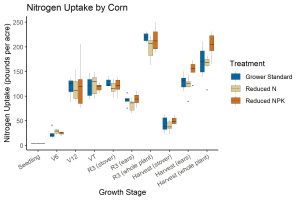
Data from this trial are presented in two ways: in tables with means and standard deviations, or using box plots. The mean represents the average of the 6 samples taken from each treatment on each sampling date, and standard deviations are provided to give readers a sense of the spread of the data. When standard deviation is smaller, all observations had values that are close to the mean. Box plots (see Fig. 2) are a graph that visually displays the median, skewness, and spread of a given data set. The solid line within each box indicates the median, and the upper and lower whiskers represent the maximum and minimum of the data. When the box is shorter in height, all observations in the data set had values that are close to the median. Outliers are represented with dots above or below the end of whisker lines. When boxes from all three treatments cover the same portion of the y-axis (in other words, the boxes start and end at similar heights), there is no evidence that treatments differed from each other.
Dry Matter Accumulation
Total plant dry matter (vegetative plus reproductive growth) was similar for plants from all fertilizer treatments (Fig. 2). Reducing the fertilizer rate did not negatively impact plant growth.
Nitrogen Accumulation
Plant N uptake on a per-acre basis at the seedling stage was greater with the Reduced N treatment compared to the Grower Standard Practice and Reduced NPK treatments (Fig. 3). N uptake was not affected by fertilizer treatment between V6 and VT growth stages. N accumulation by the stover and ears at the R3 stage was not affected by fertilizer treatment. At R3, slightly more total N was found in the stover compared with the ears. At harvest, considerably more N was found in the ears than in the stover. Similar amounts of N were found in the stover across treatments at harvest. However, more N was found in the ears at harvest with the Reduced NPK treatment compared with the Grower Standard Practice and Reduced N treatments. Total plant N accumulation at harvest was greater with the Reduced-NPK treatment compared to areas receiving the Grower Standard Practice and Reduced-N treatments. Although total N fertilizer application with the Reduced NPK treatment was 30% less than with the Grower Standard Practice, the corn plants accumulated more N with the Reduced NPK treatment than with the Grower Standard Practice.
Nitrogen Use Efficiency
Approximate fertilizer N use efficiency can be calculated by dividing plant N uptake by N fertilizer applied—this information is presented in Tables 1 and 2. N use efficiency values were: 172/363 = 47% with the Grower Standard Practice; 161/321 = 50% with the Reduced N treatment; and 204/255 = 80% with the Reduced NPK treatment. The grower values of 47% and 50% align with general “book” values of N use efficiency, but the Reduced NPK value of 80% illustrates the greater N use efficiency with the reduced-fertilizer program. The Reduced NPK fertilizer program is similar to current IFAS fertilizer rate recommendations. Total N accumulation at harvest is slightly lower than at R3 due to leaf senescence, resulting is slightly higher N use efficiency values, but does not change the relative ranking.
Note: N mineralized from the soil were not measured, so fertilizer N use efficiency calculations include unknown N from the soil as an N input, along with N fertilizer and manure—this causes all 3 calculated N use efficiency values in this demonstration to be slightly inflated, although these values can still be used to effectively compare treatments.
Table 2. Mean N accumulation of corn plants per acre at six growth stages. Values are in lb/acre N with standard deviation provided parenthetically.
| Treatment | seedling | V6 | V12 | VT | R3 stover | R3 ears | R3 Total | Harvest stover | Harvest ears | Harvest Total |
| Corn plant N uptake (lbs/acre) with Sd* in parentheses | ||||||||||
| Grower Standard Practice | 3.4 (0.4) | 23.1 (9.5) | 118.8 (18.9) | 119.3 (21.5) | 127.7 (8.9) | 92.0 (10.1) | 219.7 (9.1) | 42.6
(15.8) |
129.3 (14.7) | 172.0
(29.1) |
| Reduced N | 4.2 (0.2) | 28.2 (4.8) | 115.5 (25.0) | 123.3 (22.3) | 116.8 (13.7) | 81.4 (12.5) | 198.3 (23.7) | 39.2
(10.7) |
122.1 (18.3) | 161.3
(25.0) |
| Reduced NPK | 3.5 (0.2) | 24.8 (3.6) | 122.1 (48.0) | 117.7 (8.1) | 121.0 (15.9) | 94.1 (12.8) | 215.1 (24.9) | 50.3
(7.9) |
153.4 (18.4) | 203.7
(24.8) |
*Standard deviation
Phosphorous and Potassium Accumulation
Plant accumulation of N, P (P2O5), and K (K2O) was measured at harvest (Table 3). Total-plant N uptake was greatest in the Reduced NPK treatment areas. Total P accumulation with the Reduced N treatment was less than with the other two treatments. The uptake of K with the Reduced NPK treatment was greater than the Grower Standard Practice or Reduced N treatments. Kernel uptake of all three nutrients was similar between the Grower Standard Practice and Reduced NPK treatments and lowest with the Reduced-N treatment.
Table 3. Mean corn total-season whole-plant P and K uptake. Values are in lb/acre with standard deviation provided parenthetically.
| Treatment | Total Plant | Kernels | ||||
| N | P2O5 | K2O | N | P2O5 | K2O | |
| Plant uptake (lb/acre) with Sd* | ||||||
| Grower Standard Practice | 172.0 (29.1) | 105.2 (13.5) | 217.4 (51.1) | 171.9 (32.5) | 91.9 (14.8) | 56.3 (8.0) |
| Reduced N | 161.3 (25.0) | 96.8 (13.8) | 219.8 (57.5) | 135.5 (16) | 72.5 (10.9) | 43.9 (5.8) |
| Reduced NPK | 203.7 (24.8) | 122.4 (17.6) | 260.3 (29.0) | 163.8 (18) | 85.1 (12.3) | 51.9 (6.2) |
*Standard deviation
Ear-Leaf Nutrient Concentration
Results with nutrient concentrations in the ear leaf at the VT stage confirm results with plant growth and nutrient accumulation – that reducing N, P, and K fertilization did not negatively affect corn growth and nutrient accumulation. Ear-leaf N, P, and K concentrations were similar across all fertilizer treatments (Fig. 4). Ear-leaf concentrations were all within the sufficiency ranges.

Grain Yield
Grain yield was measured by two methods (plot weights where n = 6, and from the grower combine where n = 1). Grain yield was affected by fertilizer treatment as measured from plot yields (Table 4). Yields with the Grower Standard Practice and Reduced NPK treatments were similar, and yield with the Reduced N program was the lowest. The combine harvest data was measured using truck weights, and the results are from only one observation of 10 acres for each treatment. Yields were similar among all 3 treatments.
Table 4. Corn grain yield measured by two methods. Results in the first two columns came from plot samples (n=6) dried until 0% moisture. Results in the last column were from the farmer combine harvest at 21% moisture. Values in parens are standard deviations.
| Plot Samples | Combine Harvest | |||
| Treatment | kg/plot | bu/ acre (0% moisture) | bu/acre (21% moisture) | lb N applied per bu corn** |
| Grower Standard Practice | 1.20 (0.16) | 270 | 265 | 1.37 |
| Reduced N | 1.02 (0.12) | 226 | 300 | 1.07 |
| Reduced NPK | 1.13 (0.09) | 253 | 282 | 0.90 |
** Total N fertilizer divided by yield in bushels per acre at 21% moisture
Rule-of-Thumb Relationship between Yield and Nitrogen Rate
A rule-of-thumb has often been proposed that corn needs about 1.2-1.3 lbs of N applied for every bushel of corn anticipated. Our results in Table 4 clearly show that this rule-of-thumb may lead to overfertilization with nitrogen. The same grain yields were produced with 0.9 lbs N per bushel with the Reduced NPK treatment compared with 1.37 N per bushel with the Grower Standard Practice. The least amount of N cost was invested in the corn with the Reduced NPK treatment. These yield results show that reducing N, P, and K fertilizers is possible without negatively impacting corn yield.
Take Home Messages
Our results demonstrated that using 255 lbs of N per acre for corn planted at 37,000 seeds per acre produced the following outcomes:
- Equal yield to using more than 300 lbs/acre N.
- Plants under high fertilization rates did not take up more N, P, or K than plants with the lowest fertilizer rates.
- Much greater N use efficiency.
Equal yield at a lower N rate without losing yield allows the farmer to save fertilizer money, making the corn production system more profitable. Additionally, the greater N use efficiency at the lower N rate indicates that the chance of N being lost to the environment is also reduced.
References
Borisova, T., Racevskis, L. and Jennison, K. 2012. Stakeholder Analysis of a Collaborative Watershed Management Process: A Florida Case Study. JAWRA Journal of the American Water Resources Association. 48. 277-296. 10.1111/j.1752-1688.2011.00615.x.
Hansen, Terry, P.G. 2018. Division of Environmental Assessment and Restoration Water Quality Restoration Program Florida Department of Environmental Protection. Suwannee River Basin Management Action Plan (Lower Suwannee River, Middle Suwannee River, and Withlacoochee River Sub-basins). https://floridadep.gov/sites/default/files/Suwannee%20Final%202018.pdf
UF/IFAS Standardized Fertilization Recommendations for Agronomic Crops. 2021. R. Mylavarapu, D. Wright, and G. Kidder. University of Florida Cooperative Extension Publication SL129. https://edis.ifas.ufl.edu/publication/ss163
Wright, D., Marois, J., Rich, J., Rowland, D., and Mulvaney, M. 2018. Field Corn Production Guide. University of Florida Cooperative Extension Circ. SS-AGR-85. http://edis.ifas.ufl.edu/ag202
 3
3
