Being a marine biologist, I’ve always looked at the oceans and estuaries from the water – in, on, under – my marine biology world has been one of close contact, until last year. Last year is when I started working with a small group of oceanographers from the National Oceanic and Atmospheric administration, better known as NOAA, who study the oceans from space. Now I must admit, I’ve always thought rockets and spaceships were cool, but not cool enough for me to delve into the details. But now, that’s exactly what I’m doing. And it’s fascinating!
Satellites help us see the world
Scientists are able to view oceans from space using satellites. Simply put, satellites are any object that orbits or encircles another object. This means the moon and the earth are satellites. But what most people typically think of when they hear the word satellite, is a man-made object, that is intentionally put in space.
The first man-made satellite, called Sputnik, was launch by the former Soviet Union on October 4th, 1957. It was about the size of a beach ball. On January 31st, 1958, the United States followed with the launch of Explorer I. This satellite discovered the magnetic radiation belts around the Earth. Cool huh!
Different types for different jobs
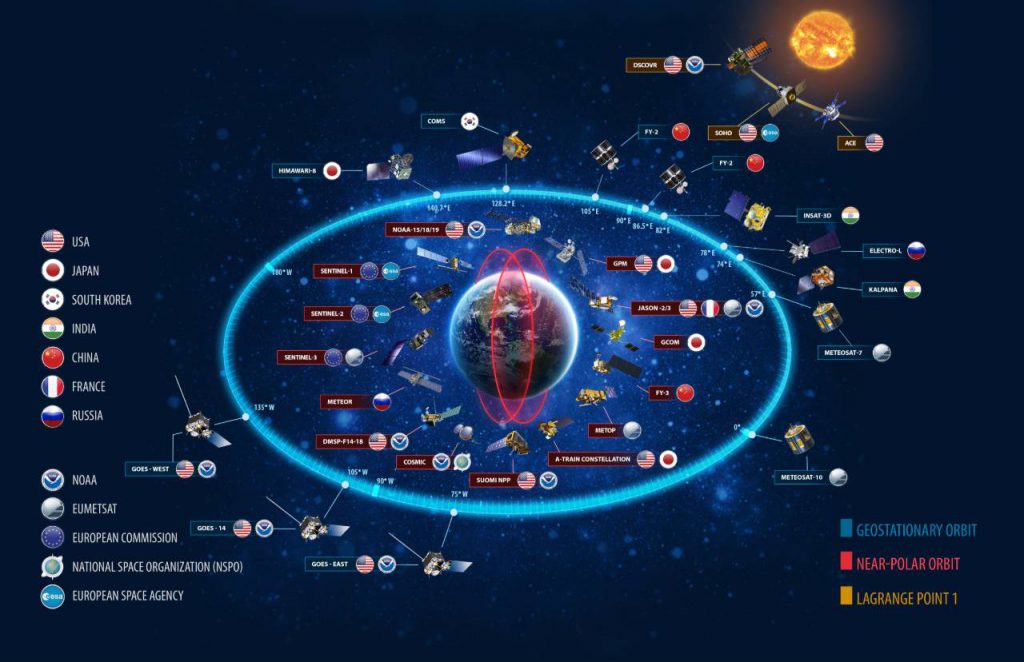
Today there are about 2000 satellites world-wide and each satellite has a job to do. Most satellites look down at Earth. They have cameras and equipment capable of seeing our world through various wavelengths of light. A smaller number of satellites look toward space. These capture vistas of stars, planets and galaxies.
Information gathered by downward facing satellites can tell us a lot about the oceans. Scientists can use satellites to examine ocean depth – known as bathymetry, sea surface temperature, ocean color, coral reefs, and sea ice. The oceanographers I work with are interested in ocean color.
Let’s focus on ocean color
The ocean’s color is determined by light that is reflected by the water and the substances present in it. Sunlight enters ocean water, most of it is absorbed by the water, but some bounces around on particles, floating algae (usually microscopic) called phytoplankton, and water molecules, then bounces back up toward space. Water reflects blue light and absorbs red light particularly well, which is why it looks blue. Some substances in the ocean, like chlorophyll, also absorb light. Others, like sediment particles, reflect or scatter light. Reflected light bounces away at a singular predictable angle, while scattering bounces light off in multiple directions. Absorbed light is converted to heat in the water.
Phytoplankton contains chlorophyll (a plant color pigment), which absorbs red and blue light and reflects green light. Satellite instruments measure the amount of light coming from the water at different colors (blue, green, etc.). By calculating the proportion of blue to green light, the satellite indicates the concentration of phytoplankton in the water. As the concentration of chlorophyll increases, satellite images show the ocean surface changing from blue to shades of green.
Connecting to food webs
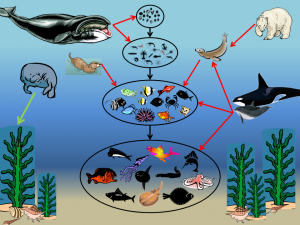
Ocean color can tell us a lot about primary productivity. You see, phytoplankton are really important in ocean systems. They are primary, because they’re at the base of the food web. And they’re productive because they convert sunlight energy to food energy which they use to sustain themselves. But little microscopic animals called zooplankton feed on the phytoplankton. Then these microscopic animals get eaten by something bigger like little fish, who are eaten by bigger fish… you get the picture. The energy produced by the phytoplankton, at the base of the food web, is transferred from prey to predator all the way to the top of the food web.
Phytoplankton thrive along coastlines because there are more nutrients there, but their growth is governed by climate and changes seasonally. Because they are so important, any change in their population could have a significant impact across the ocean, and even on land, which is why scientists want to study them.
Too much of a good thing
Phytoplankton is necessary and usually an important part of the ocean ecosystem. Sometimes, phytoplankton can cause problems. If there are too many nutrients in the water, called eutrophication, the phytoplankton might grow to really high concentrations, called an “algal bloom”. These blooms can get out of control and cause environmental problems. They might shade the bottom, blocking the sunlight needed by seagrasses and other rooted plants, or when they die, the decomposition can consume so much oxygen that not enough is left for fish and wildlife to survive.
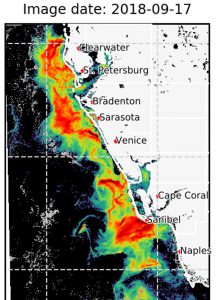
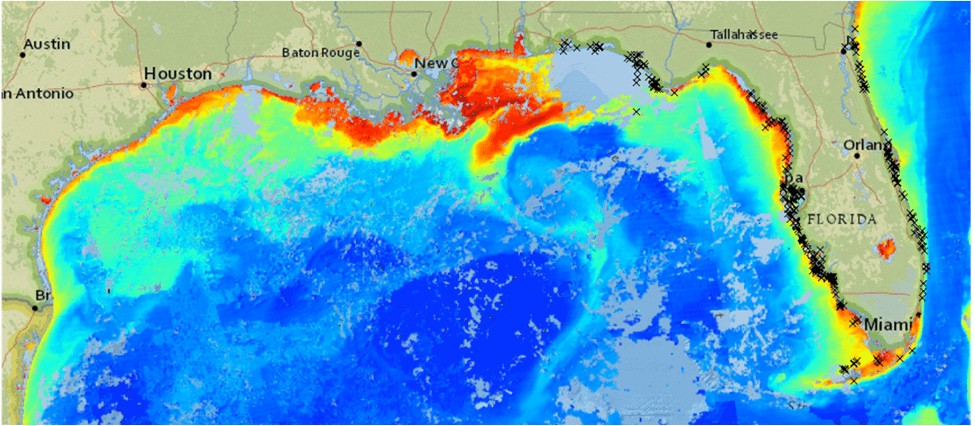
Some phytoplankton produces toxins. When these types grow, scientists call them harmful algal blooms or HABs for short. Different HABs produce different toxins, some are harmful to wildlife, and some to humans. Satellite color data helps oceanographers locate and track these harmful blooms, providing an early warning to people. This is what the oceanographers I work with do.
They produce HAB forecasts using ocean color satellites. These forecasts provide early warning to health officials, environmental managers and water treatment facility operators, by finding blooms that are potentially harmful, determining how big they are, and where they are likely headed. To illustrate this, most ocean color imagery uses a color palette ranging from purple to orange or red as chlorophyll concentration increases.
In order to develop HAB forecasts, oceanographers need to know what causes different HABs and how these HABs react to changes in weather and ocean conditions. This is no easy task.
How do they do it?
Using the current ocean color satellites, oceanographers can’t directly identify algal species or determine if they are harmful. But harmful species tend to occur under particular conditions, so by finding heavy bloom concentrations and seeing how the bloom interacts with its environment, they can often separate different types of algae.
For instance, dinoflagellates, a type of algae, have two whip-like flagella that they use to propel themselves through the water, often swimming up to the surface. Some types of dinoflagellates produce toxins. Diatoms, another type of algae, are heavy and can’t swim. While some diatoms produce toxins, most do not. Diatoms tend to be mixed in the water column by wind and currents and don’t gather at the surface. Diatoms can also cause more scattering, because their outer surface is made of a substance called silica. Knowledge about these differences can help oceanographers identify blooms that are more likely to be dinoflagellates or diatoms, or other types of algae. To determine if a bloom is harmful, oceanographers must often combine satellite images with field samples and models.
There are limitations
Ocean color sensing presents a number of limitations that oceanographers must contend with. Ocean color sensors cannot see through clouds, so on cloudy days, patches of phytoplankton may be missed. Also, certain times of the year, based on how the satellites are oriented, bright patches of light called glint, mask features that are usually visible, making it impossible to see a bloom.
Another challenging limitation is that of size, or spatial resolution. Each image produced is comprised of a collection of pixels. Each pixel averages the light coming from a “square” of water. One of the better satellites for finding algae has a pixel size of 300 m (1000 feet), about the size of a football stadium. So, if the resolution is 300 meters, the pixel is the average of all of the features in a 300×300 meter square location. This means a 300-meter sensor cannot see something small like a whale because most of the pixel will be made up of the surrounding water.
Due to this limitation, oceanographers cannot determine things right at the coast with most ocean color sensors, because the first pixel is a mix of land and water information. But coastlines are complicated for other reasons too. When you get closer to land, it is more difficult to accurately correct the imagery for things like smog or smoke in the air. It’s also more complicated to distinguish phytoplankton from really shallow water. And in some bays, algae can be confused with murky water caused by turbidity and dissolved pigments, which are primarily leached from decaying plant material and organic rich soils.
In the end…
To account for limitations, occasional water samples from a bloom are necessary to confirm satellite derived observations. But satellites are able to cover much larger areas than a person could on the water. They are also much more sensitive than our eye, meaning they can see what we might otherwise miss. One doesn’t have to look far to see ocean color sensing in action. Here in Florida, we rely on forecasts produced regularly by NOAA along the Gulf coast for red tide, a type of HAB produced by the dinoflagellate Karenia brevis. As such color sensing using satellites is an important tool in oceanography and compliments the in, on and underwater world of marine biology that I’m most accustomed to.
Special thanks to Rick Stumpf & Shelly Thomlinson, NOAA for their help with content.
 0
0
