Last summer Aaron Aguila had an REU (Research Experience for Undergraduates) Internship at Harvard Forest. He researched how the makeup of a forest after it gets harvested for trees is related to the risk of disease exposure in people, specifically looking at Lyme’s disease. We asked him some questions about how he found this opportunity, his experience there, and what he learned.

How did you find out about this internship?
I found out about this opportunity through my supervisor Dr. Donnelly. I work at the Center for Undergraduate Research on campus where I’m either organizing research events or helping students find research opportunities. One day, Dr. Donnelly suggested I consider an REU for my summer semester. It was as easy as searching “ecology” on the NSF website.
I made a spreadsheet of about 6 REUs, balanced between those I found most interesting and how qualified I felt I would be, with Harvard Forest as my long shot. I bothered about three professors and my supervisor for recommendation letters between all the REUs, and to my surprise Harvard Forest was the first to get back to me, before I even finished applying to the others. I got a Skype interview and was accepted a week later.
What was Harvard Forest like?
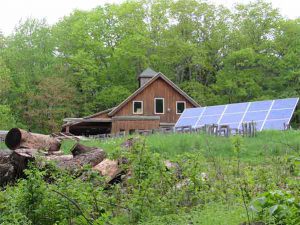
Harvard Forest is, as its name suggests, made up of mostly forest. It’s within the small town of Petersham, Massachusetts, about 2 hours away from the main Harvard campus in Cambridge.
The living situation was great – we had a personal chef, 4 bathrooms, and everything from meals and lodging to airfare paid for. The staff were welcoming, and our mentors gave 110% towards answering all our questions and guiding us through our research. My peers were a diverse group of students from as far off as Guam or California and over time we all became a close-knit family.
What did you do?

Between my mentors, my research partner, and myself, we collected enormous amounts of data on the forest structure for a “post-harvest carbon dynamics and forest biodiversity” study – something close to 10,000 observations.
Everything from a tree’s diameter at breast height to the number of seedlings to the species identification of plants within our approximately fifty 20-meter by 20-meter plots got recorded in our datasheets, all to quantify the amount of carbon in the forest. Our question was whether the carbon previously contained there was returning after harvest, along with the larger question of how sustainable the resource management regime was, but I wanted to add an extra dimension to the concept of sustainability. I wanted to find out if the post-harvest forest biodiversity had effects on people and in turn, redefine sustainable resource management practices to incorporate sustainable disease prevention. A forest may be growing back after harvest with a sustainable amount of carbon, but it is worth asking what kinds of ecological changes and interactions happen between harvest periods that could affect people and make the process unsustainable from a public health perspective, so I sampled ticks in plots that had been subject to different harvest intensities and tested them for Lyme disease.
First, I volunteered for NEON (National Ecological Observation Network) for a day to understand their tick collecting protocol. A few trips to Walmart later I had the supplies I needed to tick sample myself. The ticks were stored in vials and labeled according to the harvest intensity of the plot they were found in, and at the end of the program they got shipped out to a tick testing lab.

Most of our program was spent collecting all our data, but we also had guest lecturers on interesting ecological research happening and R workshops to help us in analyzing our data. On weekends my peers and I went on trips around the New England area, from New York to Cambridge and even to Canada one weekend. We presented our findings to the public during our last week in the program.
What did you learn?

I learned how the research process works from A to Z. From how to navigate a GPS to how to measure dendrobands, the summer research experience was invaluable to me as a WEC major. I got my exposure to R programming through this REU, and my introduction to how to think about data.
It seemed as if everything I was taught from my WEC classes was applied to this program.
As to the results of my research, overall tick abundance was much higher in fully harvested plots, but this was largely driven by a species called Dermacentor variabilis, which is not a Lyme disease vector. There was no significant difference in the abundance of the Lyme disease vector species Ixodes scapularis in plots of different harvest levels.
Other significant findings showed us that as trees got shorter, the abundance of D. variabilis went up, and that as the density of woody debris in a plot went up so did the abundance of Lyme disease vector I. scapularis. Additionally, sedge species Carex pensylvanica was an indicator species of ticks. I am still waiting on the lab results to confirm if the Lyme disease vector ticks had the bacteria in them, and hoping to learn more from those results.
________________________________________________
For more information about REU’s, click here to visit the Center for Undergraduate Research
For more information about the Harvard Forest, click here.
To learn more about Wildlife Ecology at UF, click here.
This interview by Rhett Barker.
Thanks to Aaron Aguila for answering our questions.
 0
0
