It may be cliche to say that a picture is worth a thousand words, but in the Local Food Economics Data Visualization Challenge at this year’s Agricultural & Applied Economics Association (AAEA) annual meeting, that’s exactly what UF Food and Resource Economics Ph.D. students Prabin Adhikari, Yetian Cai and Chenxi Hu set out to accomplish, ultimately placing second in the highly competitive, national competition.
“A well-designed figure communicates a result far more intuitively than a paragraph of text, so it is one of the most effective ways to extend the reach and impact of our work,” Cai said.
Of the 24 teams that signed up for the competition, only 8 were selected to take on the challenge. The eight teams of graduate students worked from mid-May up until the AAEA Annual Meeting preparing data visualizations to respond to the challenge prompt.
“Finishing second among those eight teams was incredibly rewarding, especially after all the time and effort we had put into the project throughout the summer,” Adhikari said.
Due to the very nature of the Food and Resource Economics discipline and the topics often covered, Cai points out that data visualization skills are particularly relevant in revealing insights that might otherwise remain hidden.
“Production, infrastructure, markets, and the people affected by policy are all located somewhere. So much of the data we work with is inherently geospatial, Cai said. “Mapping and visualizing that data is a very natural next step, and looking at a question through the spatial lens often surfaces patterns you would never see in a regression table”
In addition to enhancing the insights available, illustrative and accurate data visualization also empowers understanding for broader groups of stakeholders looking for actionable insights.
“Data visualization is an important skill for economists, and this competition required exactly the thing I wanted practice with: turning an estimate into something a stakeholder can act on,” Hu said. “Someone should be able to look at a map and immediately see what to do.”
As they worked to develop their project, the students were assigned three expert mentors: Dr. Becca Jablonski from Cornell University, along with Lacy Stephens and Americo Vega Labiosa from the USDA Marketing Service.
“We arranged three meetings with them to discuss the topic, our ideas, and the direction we wanted to take, and their feedback was extremely helpful in shaping our final approach,” Adhikari said. “As a team, we also met weekly, divided the work among ourselves, shared our progress, and discussed how all the pieces could come together into one clear story.”
While the overall topic of the challenge was local food economics, the UF Food and Resource Economics Graduate Student team was assigned specifically to look at the vegetables, legumes, and pulses sector. From there, they were given the creative freedom to identify a timely topic of their choosing.
“Most of our early weeks went into choosing the topic rather than the analysis,” Hu said. “We wanted something that mattered to local food systems and that someone could actually use, and our ideas changed a lot before we landed on food hub infrastructure gaps.”
According to the team, the topic of food hubs is particularly timely for producers in these sectors due to the recent growth in local food sales coming from intermediated channels.
“Food hubs are the connective tissue between small and mid-sized farms and larger buyers like schools and hospitals,” Hu said. “When there isn’t one within reach, growers who could be selling locally simply can’t. Given how much attention supply chain resilience has gotten recently, knowing exactly where those gaps are is a practical question, not just an academic one.”
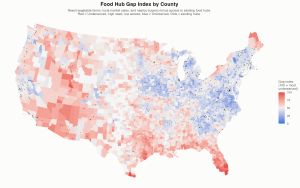
Through data visualization, the team was able to illustrate exactly how the currently existing food hubs in the United States are operating, as well as identify areas where a link may be missing.
“The problem is that most U.S. vegetable farms are too small to supply those buyers reliably on their own, and food hubs exist precisely to aggregate their products and move them into wholesale and institutional markets,” Cai said. “USDA funds this infrastructure through programs, but those programs are applicant-driven, so we wanted to ask whether the infrastructure is actually landing where it is needed most.”
Moving forward, the three look forward to continuing to utilize and strengthen the skills honed through this competition in their daily work as applied economists.
“As economists, we work with a lot of data,” Adhikari said. “Even in our day-to-day research, we are constantly trying to extract meaningful information from data and communicate those findings to fellow researchers and the general public through charts and visualizations.”
 0