The City of Tampa, Florida developed and adopted an advanced assessment and mitigation strategy for urban forest canopy conservation. This strategy supports the City’s Urban Forest Management Plan (Northrop et al., 2013) that links forest monitoring and regulatory policies to the achievement of the maintenance of 2013 urban tree canopy levels.
Canopy Assessment
Detailed canopy assessments are conducted every five years, in accordance with Tampa’s UFMP (Northrop et al. 2013). For these assessments, tree cover distribution is estimated (95%±1%) through classification of high-resolution imagery. An independent dot-based change analysis method (Nowak et al. 2007) using 3,000 randomly selected points is used to estimate total canopy change. The maps and data produced by these three methods are used to assist with development and monitoring of urban tree policies. These assessment tools now allow the City of Tampa to require the mitigation of urban tree canopy loss within 5 years of removal. Field level canopy estimates using iTree methodology were found to have accuracy levels that made them unusable for long-term city planning and management.
Canopy Mitigation
Prior to adoption of the Urban Forest Management Plan (UFMP) in 2013 mitigation of urban tree removal was based upon a diameter replacement calculation. Each inch of diameter, measured at breast height, was to be replaced at a rate of 2:1 caliper of nursery trees. Where tree replacement could not be reasonably accomplished fees were paid into a City Tree Mitigation account. There was no scientific basis for the mitigation calculations or City Tree Mitigation procedure. The 2013 UFMP required the use of scientific proof for management and policy.
Since presently most of the measurable bio-physical ecosystem services are associated with tree canopy cover (leaf area) and its distribution the City moved to a mitigation procedure and policy of canopy cover replacement within its five Planning Districts. All mitigation now occurs within the Planning District in which canopy cover was lost. Each Planning District has a unique design and development history, particular physical characteristics and issues, provides various benefits, and serves different needs. Using the Planning District as a first cut for mitigation supports the City’s inherent diversity of planting types and uses. Mitigation now occurs on public or private land.
Initially individual tree canopy loss was to be based upon three dimensional canopy volume calculations in the field. Due to arborists’ reported difficulty in the measurement of live canopy height the three dimensional calculations were adjusted to use average crown diameter and tree shape characteristics found in the State of Florida Grades and Standards for Nursery Plants (2015). The City of Tampa’s Tree Matrix (Northrop et al.2013) which documents optimal (tree) bio-physical site characteristics is used to identify specific locations for species specific planting within the Planning District which lost the canopy cover. Together these procedures achieve a more efficient and equitable mitigation of canopy cover and its distribution.
Canopy Footprint Mitigation by Tree
Steps in Mitigation Calculation
Step #1: Crown footprint (ft2)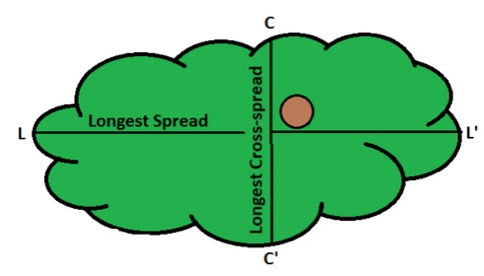
Area = 3.17r2 r = (C + L)/4
Step #2: A x Species Rating for Urban Environments1
Step #3: X Condition Class Rating2 (%) = required replacement crown area
Step #4: / Tree Type3 = number of mitigation trees Tree type:
Example: Live oak, Quercus virginianna
- Radius = (45 + 60 = 100)/ 2 / 2 = 26.25 ft
- Canopy footprint = 14 x (26.25)2 = 2164 sq ft
- Required replacement: 2164 sq ft x (Species Rating1) 9 x (Condition Class2) 0.9 = 1,753 sq ft
- Live oak is a Type 1 tree, Type 1 tree (2.5” caliper nursery stock) in 5 years = 154 sq ft canopy footprint (10″ caliper)
- 1,753/154 = Canopy Mitigation Requirement 11 trees (2.5” caliper) which will restore canopy levels within 5 years
1 Florida ISA Species Rating for Trees in Urban Environments – Tree species ratings were developed usingthe expertise of arborists and other tree experts throughout the State of Florida. Tree species were rated basedon their suitability and performance as ‘urban trees’. Rating arborists were asked to rate them based on thefollowing criteria: growth rate; structure; life span; compartmentalization; urban tolerance and requiredmaintenance.
2 Condition Class Rating – Tree Hazard Evaluation Method (Matheny and Clark 1994) evaluates roots, trunk,limb structure, twigs and foliage to generate a general rating of A = 100%; B = 90%; C = 75%; D = 40%; F= 0%.
3 Tree Type – Florida Grades and Standards for Nursery Stock Type 1– Tall and Wide form
Type 2 – Tall and Narrow form
Type 3 – Short/Wide and Multi-trunked form
We are conducting the City of Tampa’s 4th ecological analysis in 2021 and are expecting to be able to develop localized growth curves for common trees in the region. This will lead to a more robust calculation of canopy mitigation parameters
Citations
Matheny, N. and J. Clark. 1994. A Photographic Guide to the Evaluation of Hazard Trees in Urban Areas. 2nd Ed. International Society of Arboriculture, Champaign, IL.
Nowak, D. J., Dwyer, J. F., 2007, Understanding the Benefits and Costs of Urban Forest Ecosystems, in: Handbook of Urban and Community Forestry in the Northeast (J. E. Kuser, ed.), Springer, New York, pp.11-25.
 0
0
