By James Fletcher
Drones or sUAS (small umanned aircraft systems) is the new buzz word. Businesses are developing more innovative ways to use them in industry. Agriculture is one of those sectors. Drones can help survey crops and provide useful details about plant health and growth characteristics. At UF we are working to develop algorithms for irrigation management, nutrient demand, and many other areas. Currently, we are working with sod producers to develop baseline maps using multispectral sensors to identify plant health by looking at coloring of images. This is better known as normalize differential vegetative index or NDVI.

There are many different types of drones to choose from including: quadcopters, hexacopters, and fix wing craft. The more important and expensive item is the sensor or camera. Some of the more common sensors for use in your Extension program include visual, multispectral, and thermal. A visual sensor is basically a camera not much different than the camera on your cell phone. The visual and multispectral cameras have very high resolution producing images that are 4K or 3840×2160 pixels. The multi spectral sensor can produce NDVI images used to quantify the photosynthetic capacity in a plant by looking at the amount of green in the image (figure 1). The image produced provides information the human eye cannot see. Multispectral imaging uses band width between 450 and 700 nm (Wikipedia, 2017).
Thermal imaging can be used to detect plant water stress and irrigation management. Resolution is not as good as the visual sensor (eg. 640 x 512 pixels). Thermal imaging uses band width from 9000 to 14000 nm ( Wikipedia, 2017). It operates by converting infrared radiation (IR) into a visual image that shows temperature variations in a plant. These plant temperature variations correlate to water stress in the plant.
How can this technology be used to help identify problems in the field? Seen here are both visual and multispectral images in a sod field showing damage due to a post emergence weed application in St. Augustine grass. Looking closely at the visual picture on the left, we can see the yellowing effects on the grass (figure 2). Using a multispectral sensor, produces the image on the right that shows the details of damage much better in yellow and red (figure 3).
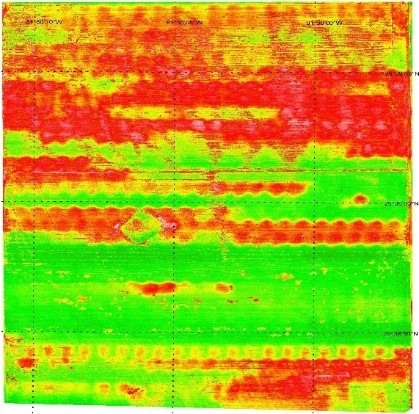

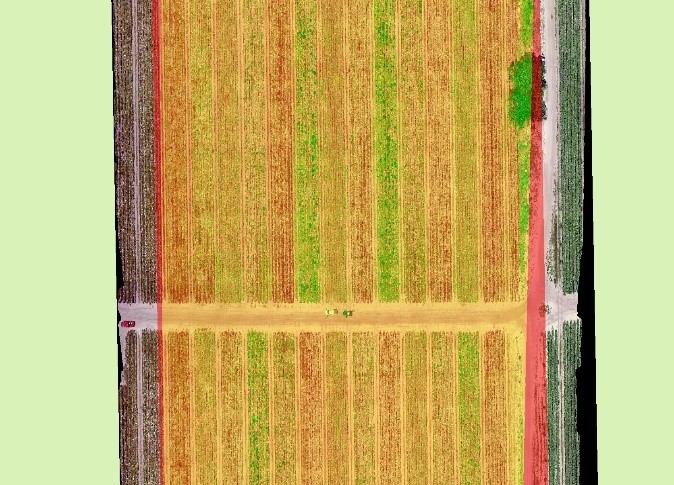
The following 2 pictures are a project in Immokalee looking at efficacy of herbicides treatments in cucumber. The visual sensor in figure 4 on the left shows the field with arrows pointing to control (green)and a treatment (brown). The multispectral sensor in figure 5 gives a clearer picture about the efficacy of the treatments. The control green indicating photosynthetic activity, yellow moderate photosynthetic activity, and red indicating low or no photosynthetic activity.

Currently, the data produced by sensors has not been quantified. However, we have developed a cohort from ABE, Hort, and Extension to develop algorithms for both multispectral and thermal imaging in effort to quantify results and make recommendations for both fertilizer and water applications. The work has just begun and we hope to have initial results over the next 2 years. Please contact me if you are interested in more information. James Fletcher, Regional Specialized Agent – Water Resources, jhfr@ufl.edu
 0
0
