In Part 1 we looked at the history, and the science, behind the climate change issue. That post discussed everything said during the early periods up to about 2010. In this post, we will look at what has happened since 2010 and will look at how the early prediction models are working. We will begin with how CO2 levels have changed over the last decade.
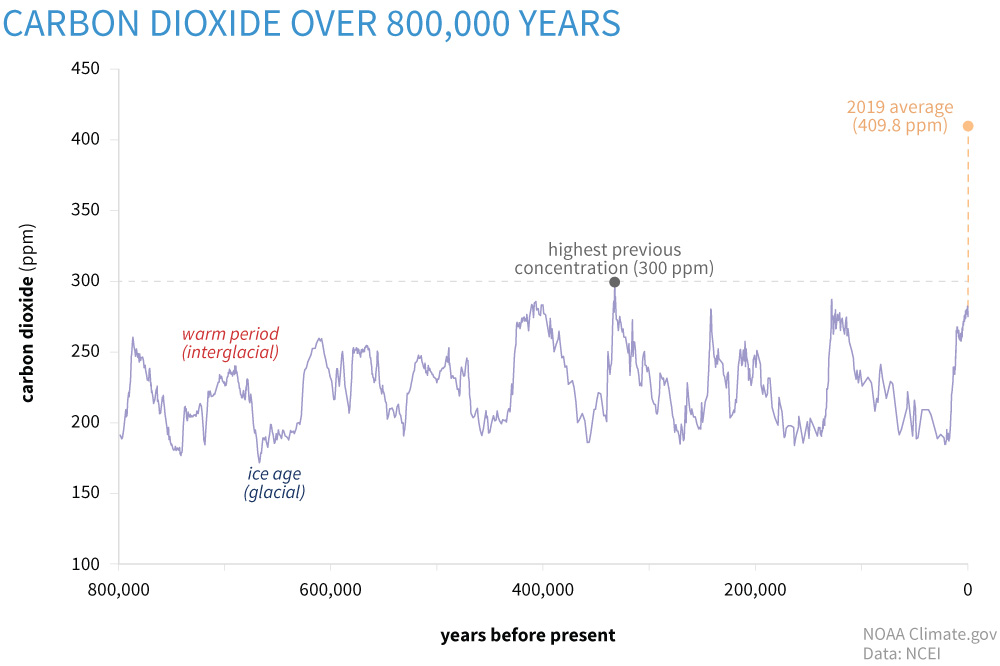
CO2 concentrations since 2007
It was mentioned in Part 1 that at the beginning of the industrial revolution the CO2 concentration in the atmosphere was at 280 ppm and had reached 384 ppm by 2007. It was also mentioned that many considered the “tipping point” for CO2 concentration was at 450 ppm11. What has happened since 2007? NOAA reports that the CO2 levels have reached 409.8 ppm (±1.0 ppm) in 2019. This is the highest recorded CO2 value in the last 800,000 years4. This suggests that greenhouse admissions do continue to climb at a rate of about 2 ppm/year. At this rate, we will pass the potential “tipping point” of 450 ppm by 2050. For obvious reasons, this is concerning.
What about extreme weather conditions?
Everyone has noticed the extreme weather conditions posted on the evening news each day. Fires out west, droughts in the southwest, floods in the Mississippi Valley, hurricanes along the Gulf coast, and blizzards/floods/and even tornados in the northeast. There have been catastrophic floods in Europe, and extreme droughts in equatorial Africa. These things have always happened, but they now seem to be more frequent, and more concerning to residents in these areas where they continually occur. They certainly match the pattern predicted by the climate models of the early 1980s and it is hard to argue when in 2020 the named tropical storms went through the entire alphabet and into the Greek alphabet before the storm season was over. Are these becoming more common? Or do they appear to be more common?
A 2021 NOAA publication on sea level rise suggest it is likely that tropical storm frequencies will increase. They work from what is called the power dissipation index (PDI). This index measures storm activity, frequency, duration, and intensity. Correlating the annual index against the annual sea surface temperatures (SSTs) of the Atlantic suggest, at medium to high confidence, the intensity of future tropical storms will increase. But they point out the frequency of storms prior to 1965 was based on ship observations at sea. Numerous storms form over the Atlantic Ocean but only last for a few days and may not make landfall. They argue that some of these could have been missed using the ship observation methods of the early 20th century. One study made a correction for this in their calculations which suggested that the frequency of todays storms may not be that significantly different from those of the earlier 20th century and that the increase could be due to better monitoring today6,7. Either way, it has become custom along the northern Gulf of Mexico to prepare for hurricanes each season, and possibly more than one. As I am writing this, it is early September, and we are currently on storm “N” – Nicholas – the 14th named storm of the season. This is certainly something that warrants continued monitoring.
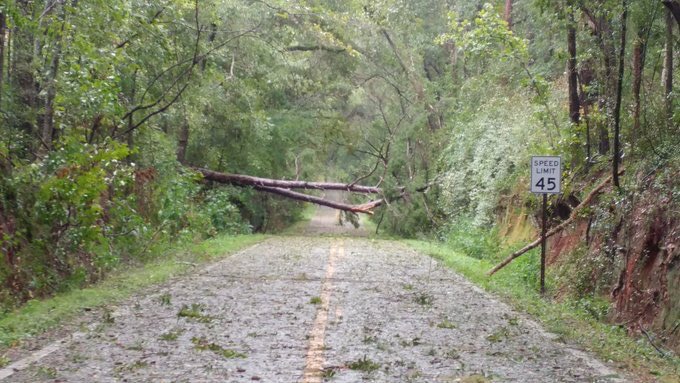
Photo: Dr. Pete Vergot.
Record temperatures
At one point during the summer of 2021 there were triple digit air temperatures all over the country. For Arizona, Texas, and Florida it is not unusual to see these high temperatures. But Oregon, North Dakota, and New England it was unusual. It seems we are breaking records on high temperatures each year, and sometimes multiple times a year for some locations. Does the science support what appears to be happening?
Yes…
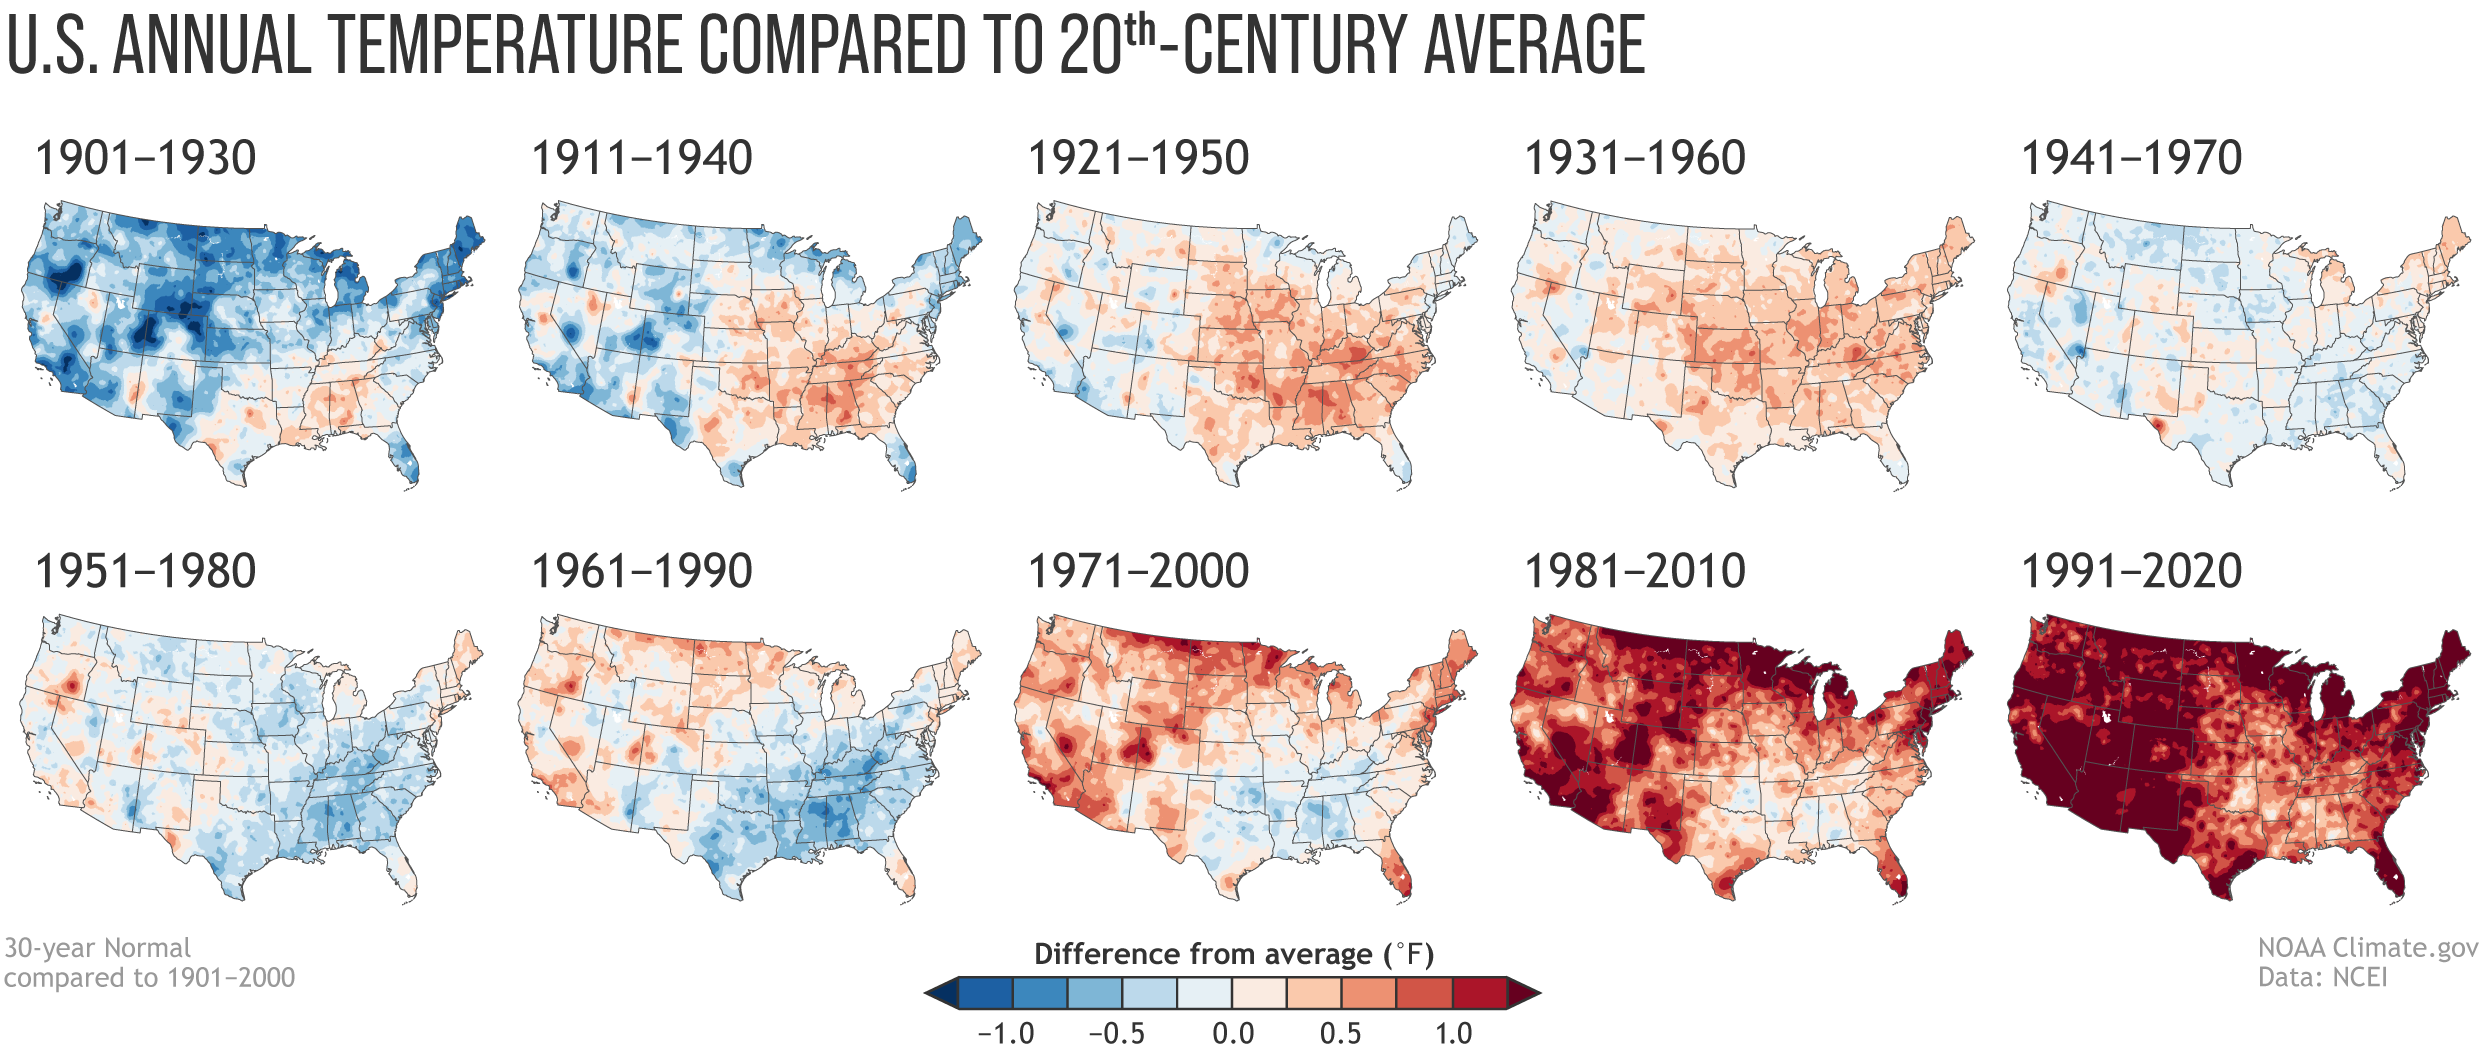
The data shows the most intense period of warming has occurred in the last 40 years and the seven most recent years are the warmest on record. This publication from NASA also states that 2016 and 2020 tied for the highest record warm days since they began collecting this data, and not only are the records highs increasing – the low temperatures reported from around the country having been increasing since 1950. It is getting warmer3.
The models developed in the 1980s suggested the wet areas of the country will become wetter, and the dry areas will become drier… is this happening?
It appears so…
In the image below published by NOAA you see a series of national maps divided by 30-year periods. The colors indicate wet and dry periods as compared to 20th century averages for those areas. The reds and browns indicate below average rainfall, the greens and blue-greens above average rainfall. You can see at the beginning of the century most of the country was near the century mean. Over the first 50 years there was dry period, which included the famous “dust bowl”. The southwest United States experienced a very dry period in the middle of the century. Beginning in the 1970s it became wetter, with the midwest and northeast become very wet since that time, and the southwest is returning to the dry periods they saw earlier in the century.
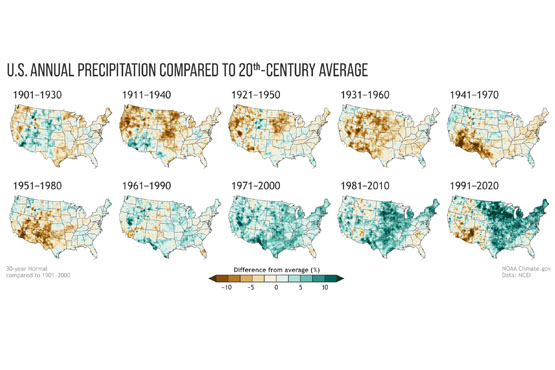
At least some of the wetness relative to the 20th century averages is linked to the warming of the atmosphere. Rising temperatures have enhanced evaporation since the 1970s and increased atmospheric moisture and humidity across the middle and eastern portion of the country8.
In a 2021 publication looking at changes in hurricanes and tropical storms, NOAA discusses what are termed “normals”. These are 30-year averages of key atmospheric and climate observations from weather stations across the country. They can be used by climatologists to assess how both the weather and climate compare to “normal” over time.
Tropicalization
This is an interesting phenomena that is occurring, and one we are watching along the northern Gulf of Mexico. The idea is basically tropical climate of the lower latitudes is moving northward across the northern hemisphere, and southward in the southern. It suggests that a warming plant is making temperate areas of the earth more tropical.
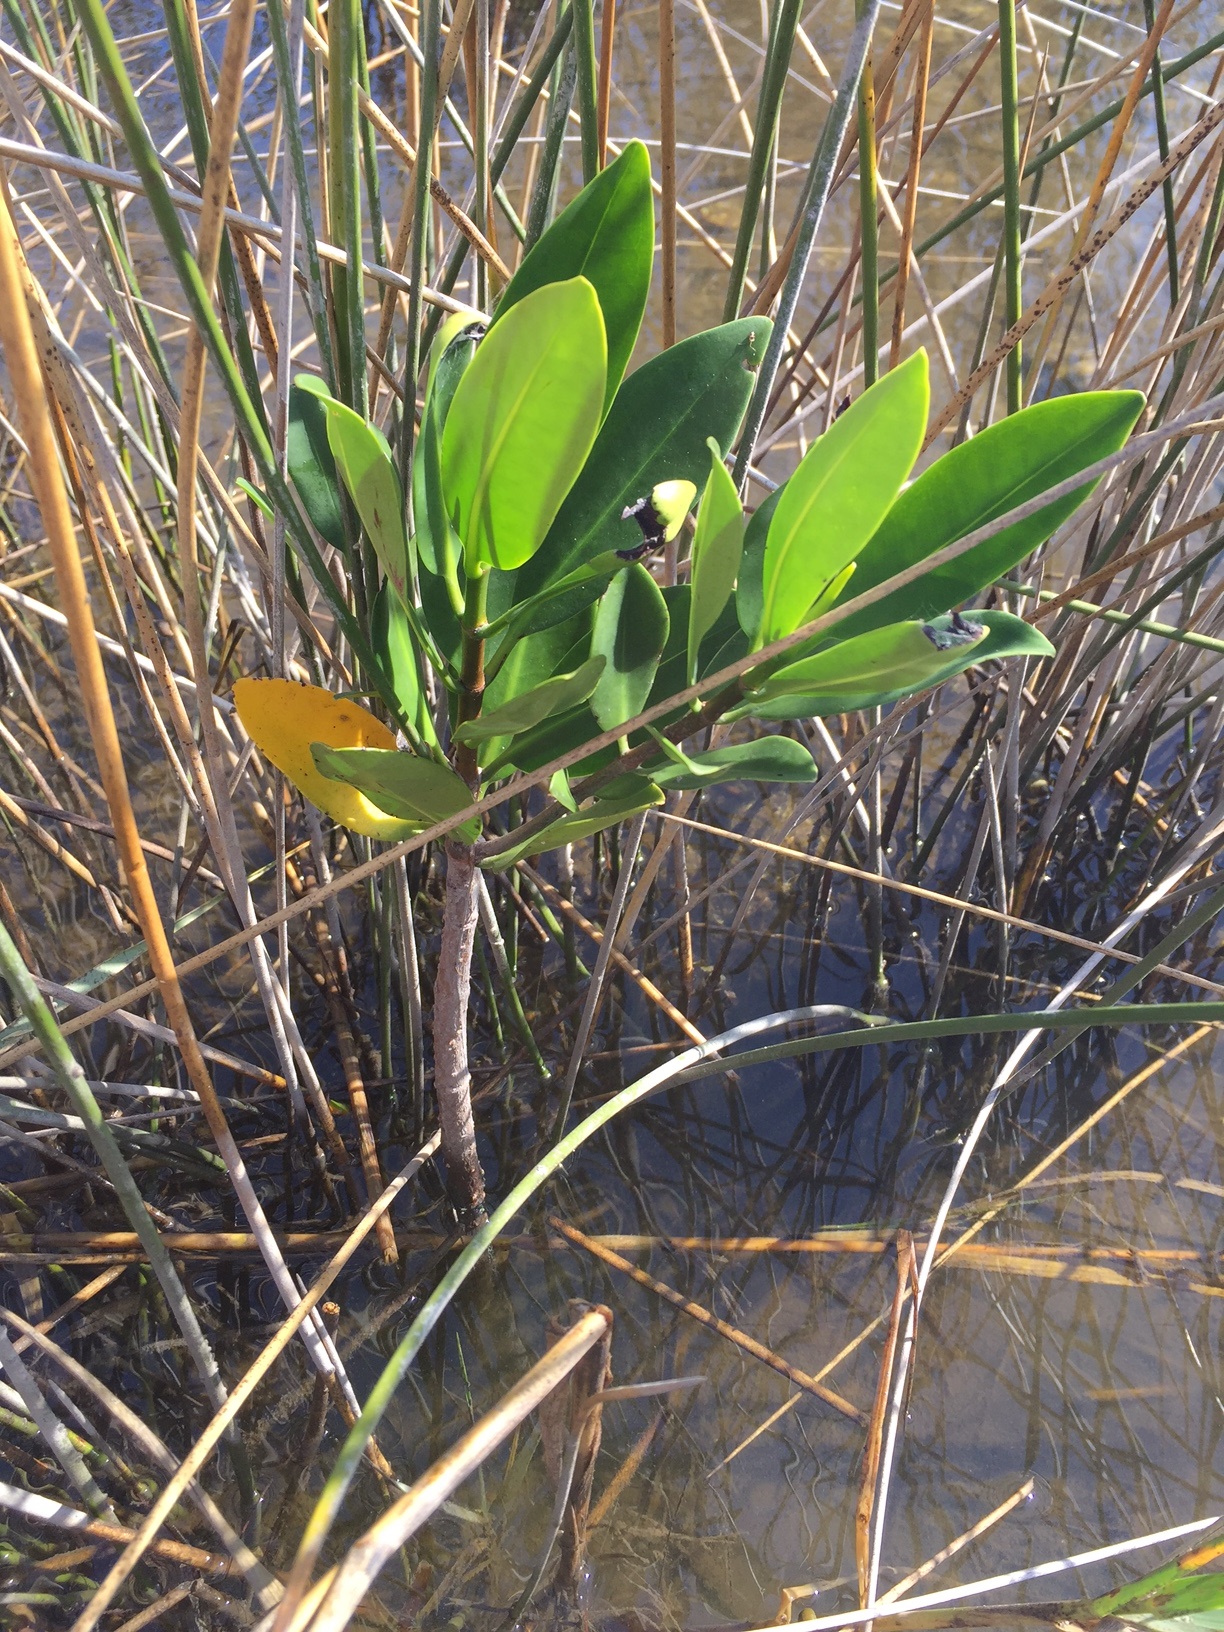
Locally in the Pensacola area, there have been reports of mangroves growing in some estuaries. Mangroves are coastal salt tolerant trees that do not do well in colder temperatures. Historically, these plants dominated the estuarine coastlines of south Florida and Keys reaching as far north as Tampa Bay area along the Gulf coast, and Indian River area on the east. Over the last few decades there has been a migration of mangroves northward. They are now established in Cedar Key on the Gulf coast and reaching the Jacksonville area along the Atlantic. But even more interesting are the reports of small groups, or individuals of mangroves even further north into Georgia, and along the northern Gulf coast including Pensacola. Working with the Pensacola-Perdido Estuary Program, Sea Grant from Mississippi-Alabama and Florida, and NOAAs National Estuarine Research Reserves along the northern Gulf, we have been conducting annual surveys for these trees since 2019. Individual plants have been reported from the barrier islands of Mississippi, coastal inlets in Pensacola and Panama City, and numerous plants in the St. Joe Bay area. Black mangroves (Avicennia germinans) are more tolerant of cold than the other species of mangroves, and they have been found across the northern Gulf. What is interesting is that the red mangrove (Rhizophora mangle) has also been found. During the mangrove surveys we have conducted here in Pensacola Bay, the nine records we have were all red mangroves. These have not become established here, as a matter of fact all nine plants died during a hard freeze in 2018, but the fact that all reached a height of about 20 inches suggested that winter seasons are warm enough, for long enough, to allow them to grow for a period of time. One red mangrove growing within Big Sabine survived for almost 10 years, reaching a height of about a meter and developing prop roots, before the hard freeze of 2018 killed it. In addition to this survey project, others have reported the expansion of these plants into the northern Gulf2, 9.

Photo: Marsha Stanton
But mangroves are only one tropical species suggesting a climate shift. Manatees are animals that have historically migrated into the northern Gulf region over the years. Having lived in Pensacola all of my life, it was not unusual to hear about 1-2 sightings each year. Most were in the summer months but some were during the winter. They were often seen near the jetties at Ft. Pickens, near Palafox Pier downtown, and in Bayou Texar. However, in recent years the number of sightings seemed to be increasing. Some of citizen science volunteers were reporting them in Big Lagoon, and many times multiple individuals at one time, one report had nine individuals at the end of a private dock – which was unusual. In 2019 Sea Grant, working with Dauphin Island Sea Lab, decided to begin a tracking/reporting project to determine how frequent these encounters were. Dauphin Island Sea Lab had been conducting a “manatee watch” for almost 10 years at that time due to an increase in encounters in the Mobile Bay area. In 2019 we logged 66 records in the Pensacola Bay area. Based on time of day and location, we could determine that at least five of these were the same individuals reported by different people. Records came from the shoreline of the Gulf of Mexico, Santa Rosa Sound, Big Lagoon, NAS Pensacola, Tarkiln Bayou, Bayou Chico, Bayou Texar, and even up in Blackwater Bay near Bagdad. There were numerous manatees exploring all over the bay. This was different. The Manatee Watch program continues with a new reporting location on the Pensacola-Perdido Bay Estuary Program’s website – www.panhandlemanatee.org – and we continue to track this.
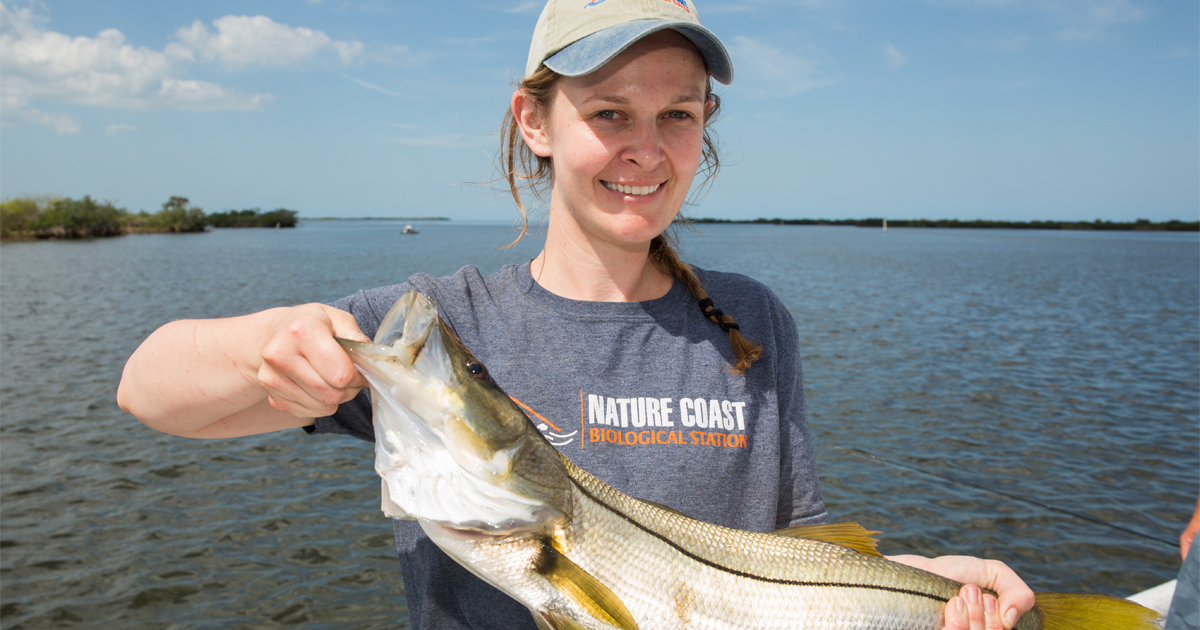
Photo: UF IFAS
Now there are reports of snook (Centropomus undecimalis) and tarpon (Megalops atlanticus) roaming the northern Gulf. These are popular game fish found in south Florida associated with mangrove swamps and are a big draw for tourism in that part of the state. There have been reports of tarpon in the Pensacola Bay area for a number of years, but they seem to pass through seasonally and anglers reported that they would not strike any type of bait (live, dead, or artificial) thrown at them. However, in recent years there have been reports of anglers catching them.
Snook are more tropical and reports of them dispersing north are more recent. They are now reported in the Cedar Key area and enough to consider including them as a charter fishing target. Other reports from the Apalachicola area and even in Pensacola – Mobile Bay areas, suggest they are visiting us – albeit in small numbers.
But researchers have been following the “tropicalization” trend not only in the Gulf of Mexico but across the planet. Much of this is due to a reduction of the number of below freezing days during the winter period. One study showed that San Francisco CA has seen a reduction of sub-freezing days. Prior to 1980 most winters had sub-freezing days. In 1949 they had a total of 17 days below freezing. However, between 1981-2020 there were only 14 days below freezing, they have only had one since 1999, and have not had any since 20089. This same report looked at Tucson AZ, New Orleans LA, and Tampa FL. Tucson has experienced a slow warming over the century. New Orleans had relatively few sub-freezing days between 1940-1950, with an increase in freezing days between 1960-1980, and over the past 30 years a reduction in those freezing days. Between 1961-1990 there were 480 days below freezing. Since 1991 there have only been 165 days below freezing. The data from Tampa FL mimics what occurred in New Orleans9.
Along with the northern expansion of tropical species there has been a shift in the traditional “planting zones” used by agriculture and horticulturists. These are zones developed to let people know which plants will do best in your climate, and when to plant them. All of these zones are shifting north8.
And then there are coral reefs…
Long associated with the tropics, many species are now being found in the northern Gulf of Mexico and one scientific team predicts that as reefs continue to struggle with increasing water temperatures and ocean acidification, they will expand northward into the Big Bend region of Florida1.
Invasive Species
Everyone has heard of invasive species and are aware of the potential problems they can cause. With all of the media about Burmese Pythons, Brazilian Pepper, and Green Iguanas, it seems south Florida is under constant attack by these creatures. It’s understandable that Miami would be ground zero for such invasions. With the heavy international traffic and warm tropical climate creatures that are either intentionally, or accidentally, brought there and escape do well.
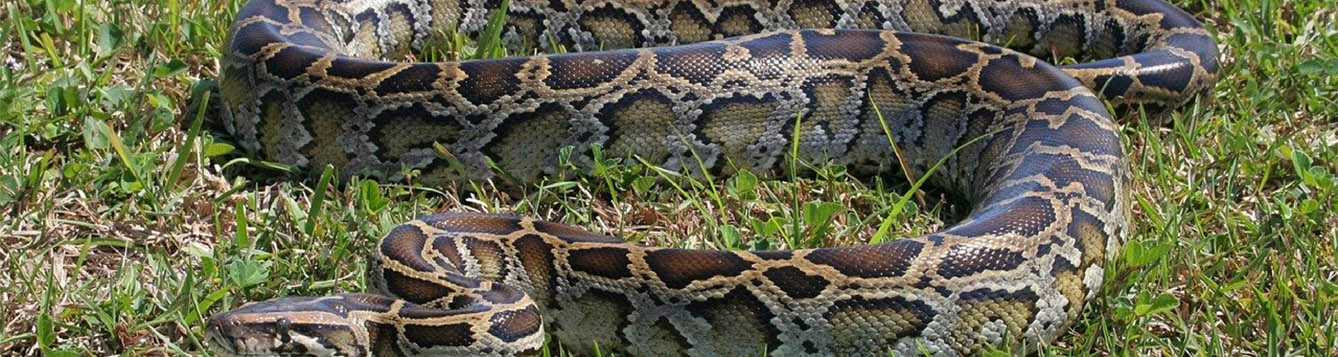
Photo: University of Florida
But most are not fond of the colder winters found in the northern Gulf of Mexico. Temperatures reaching, and sometimes exceeding, the freezing point are not unheard of. This has actually helped impede the dispersal of these tropical invasive species into the Florida panhandle.
That could be changing.
With over all milder winters we are seeing not only the tropicalization of the northern Gulf by native flora and fauna, but by non-native as well. Brazilian Pepper (Schinus terebinthifolius) has been reported on St. George Island near Apalachicola. The national database EDDMapS12 reports 18 records of the Cuban Treefrog (Osteopilus septentrionalis) in the Florida panhandle and there is reason to believe one population near Panama City may be breeding. There are 10 records of the Argentine Black and White Tegu (Salvator meriana) in the Florida panhandle and another 11 further north in the state of Georgia12.
A recent study looking at the cold tolerance of the Burmese Python (Python molurus) may be greater than we thought, that specific cold tolerant genes are becoming more common in the population, and the winters are getting milder9. All of this spells problems as these once south Florida issues begin to disperse northward.

Photo: UF IFAS
Growth Zones
Also, along the lines of tropicalization, is the northward movement of growth zones. These zones are commonly used by horticulturalists when recommending plants for certain geographic areas. For example, much of our area of the northern Gulf is in zone 8. Zone 9 (warmer climate) can be found in other portions of the northern Gulf and in peninsula Florida. There is evidence to suggest that these growth zones are migrating northward with latitude and altitude with the changing climate8. This will be important for those in the nursery and gardening industry as they select species for markets in different parts of the country. These changes will also impact what time of year people choose to plant.

Photo: Virginia Sea Grant
Corals, the Oceans, and Acidification – how have the oceans held up over the last decade?
For corals and ocean acidification, the answer is not so good.
NOAA reports that the oceans have absorbed enough CO2 to lower the pH by 0.1 – a 30% increase in acidity4. Mollusk shells, coral skeletons, etc. are made of calcium carbonate (CaCO3) which dissolves in acid. Obviously having a shell made of limestone (CaCO3) is not a good idea in an ocean that is becoming more acidic. The coral reef track has been dealing with life threatening diseases for many decades now. The increase ocean temperatures stress them, and the symbiotic microscopic plants known as zooxanthalle they rely on. This increase stress has made it easier for pathogens to attack them. There is currently a serious stony coral tissue disease spreading through the Florida reef tract that is also life threatening. The last decade has not been good for corals.
Sea Level Rise
Miami’s famous king tides…
Sea level is rising everywhere but some locations seem to be having larger issues than others. One such location is Miami FL. High tide occurs there twice a day. Twice each month, when the moon-earth-sun are all aligned during the full and new moons, the tides are larger than normal – spring tides. During certain times of the year these tides are stronger still – king tides. King tides are now covering portions of A1A in downtown Miami. These are not storm events causing flooding, they are natural high tides, just reaching higher levels because sea level is higher.
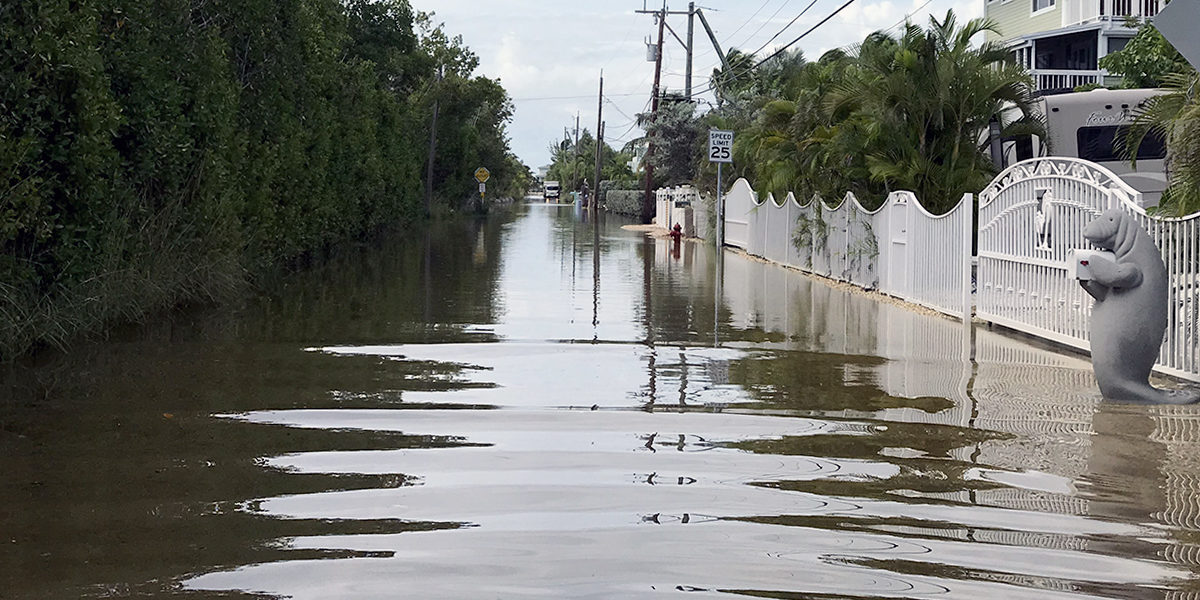
Photo: Florida Sea Grant
NASA reports that sea levels have risen eight inches over the past century and that the rate of that increase has doubled3. NOAA reports similar numbers and connects this rise to melting glaciers and expanding ocean volume due to warming. NOAA also connects the melting glaciers and expanding oceans to human activities since 19715, 7. In addition to Miami FL, there have been stories on impacts to London and Venice. Many coastal areas are beginning to see increased flooding due to both rising seas, sinking land, and increased rain events.
Data provided over the last decade do not suggest that the impacts of a changing climate have varied much from what the earlier climate models suggested. Some changes have occurred by impacts have not been noticed yet. More manatees and snook in the northern Gulf, growing/planting seasons shifting, mangroves moving north. Others have been impactful. Movement of invasive species, increased flooding, and the continued decline of our coral reefs. And we circle back to the original comment… “everyone is talking about the climate – but is anyone doing anything about it?”
In Part 3 we will review the recent report from the International Panel on Climate Change (IPCC) – Assessment Report #6 (AP6). What are the climate scientists saying about the current state of things and what are the models suggesting for the next decade.
References
1 Furman, B.T., B.J. Peterson, K.L. Heck Jr. 2020. Will the Florida Big Bend Area Become the Next Gulf of Mexico Reef Tract? Opinion Article. Frontiers in Marine Science. https://doi.org/10.3389/fmars.2020.00334.
2 Macy, A., S. Sharma, E. L. Sparks, J. Goff, K.L. Heck, M.W. Johnson, P. Harper, J. Cebrian. 2019. Tropicalization of the barrier islands of the northern Gulf of Mexico: A Comparison of herbivory and decomposition rates between smooth cordgrass (Spartina alternifloria) and black mangrove (Avicennia germinans). PLOS One. 14(1): e0210144. https://journals.plos.org/plosone/article?id=10.1371/journal.pone.0210144.
3 NASA. 2021. Global Climate Change: Vital Signs of the Planet. https://climate.nasa.gov/vital-signs/carbon-dioxide/.
4 NOAA. 2021. Climate.gov. Science and Information for a Climate Smart Nation. Climate Change and the 1991-2020 U.S. Climate Normals. https://www.climate.gov/news-features/understanding-climate/climate-change-and-1991-2020-us-climate-normals.
5 NOAA. 2021. Climate.gov. Science and Information for a Climate-Smart Nation. Carbon Emissions. https://www.climate.gov/news-features/understanding-climate/climate-change-atmospheric-carbon-dioxide.
6 NOAA. 2021. Climate.gov. Science and Information for a Climate Smart Nation. Sea Level Rise. https://www.climate.gov/news-features/understanding-climate/climate-change-global-sea-level.
7 NOAA. 2021. Geophysical Fluid Dynamics Laboratory. Global Warming and Hurricanes. https://www.gfdl.noaa.gov/global-warming-and-hurricanes/
8 NOAA. 2021. Geophysical Fluid Dynamics Laboratory. Historic Changes in Atlantic Hurricanes and Tropical Storms. https://www.gfdl.noaa.gov/historical-atlantic-hurricane-and-tropical-storm-records/
9 Osland, M.J., P.W. Stevens, M.M. Lamont, R.C. Brusca, K.M. Hart, J.H. Waddle, C.A. Langtimm, C.M. Williams, B.D. Keim, A.J. Terando, E. A. Reyier, K.E. Marshall, M.E. Loik, R.E. Boucek, A.B. Lewis, J.A. Seminoff. 2021. Tropicalization of Temperate Ecosystems in North America: The Northward Range Expansion of Tropical Organisms in Response to Warming Winter Temperatures. Global Change Biology. Wiley. DOI: 10.1111/gcb.1556.
10 Verges, A., C. Doropoulos, H.A. Malcom, M. Skye, M. Garcia-Piza. 2016. Long-Term Empirical Evidence of Ocean Warming Leading to Tropicalization of Fish Communities, Increased Herbivory, and Loss of Kelp. Proceedings of the National Academy of Sciences of the United States of Amercia. 113 (48) 13791-13796. https://doi.org/10.1073/pnas.1610725113.
11 Miller, G.T., S.E. Spoolman. 2011. Living in the Environment: Concepts, Connections, and Solutions. Brooks and Cole Publishing, Belmont CA. pp. 659.
12 Early Detection Distribution Mapping System (EDDMapS). 2021. https://www.eddmaps.org/.
 0
0
